Wow, it’s been more than a month since I last published something. So it is more than time to get going again.
This time, we will do two things: first, revisit workout-wednesday challenge 2022 – Week 15, rebuild it and discuss the challenges related to the order of operations.
Then, in Part 2 of this mini-series we will create another solution to the challenge that takes us deeper into the order of operations. The latter is the actual reason for this blog post so make sure you bear with me until the end.
With that being said, here is the challenge:
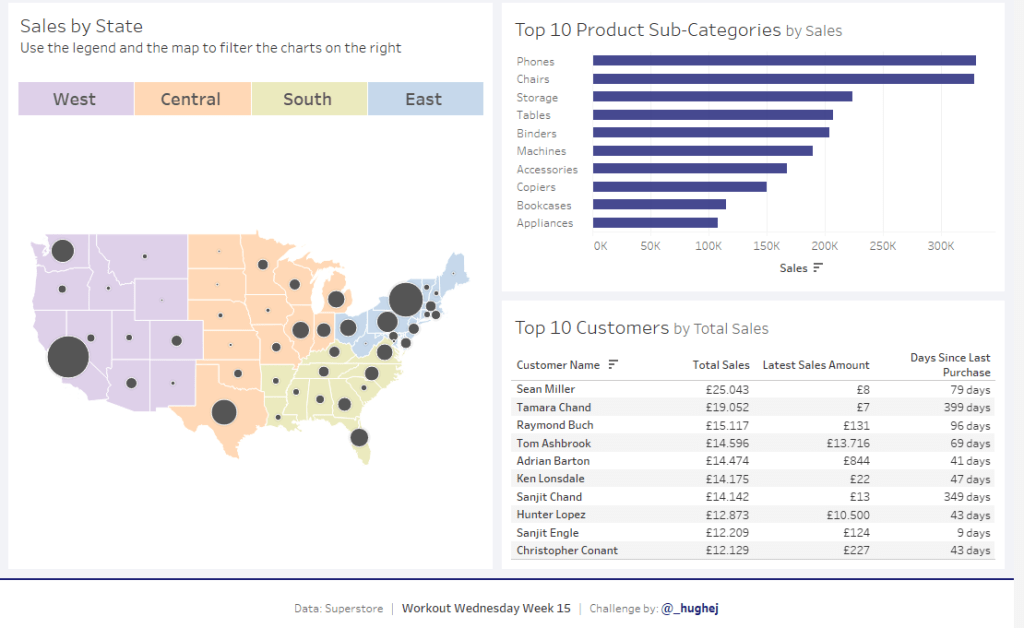
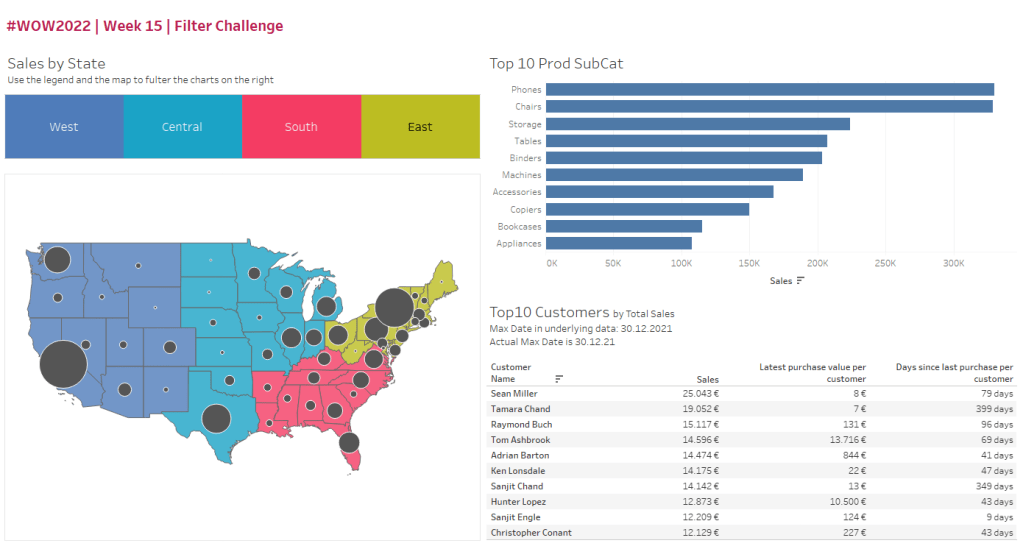
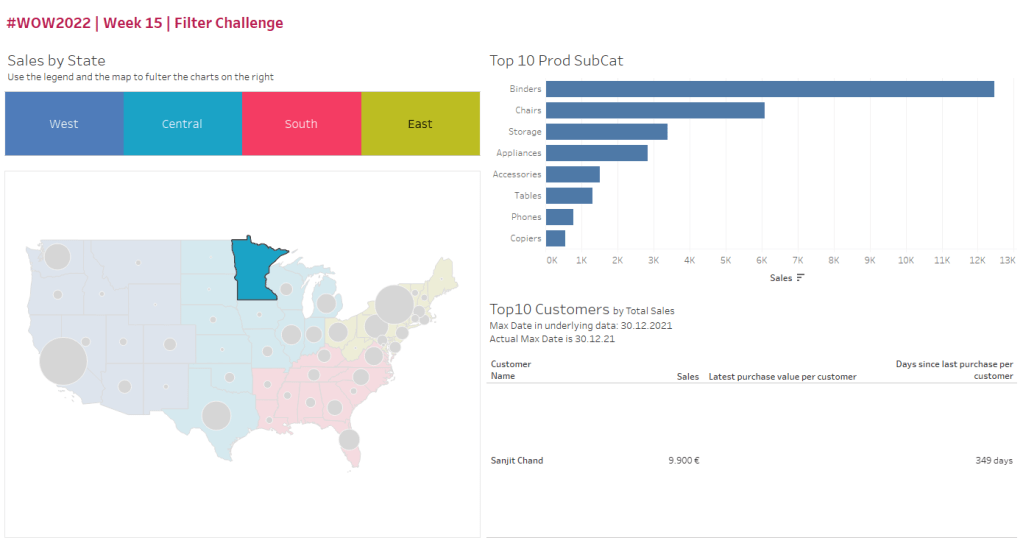
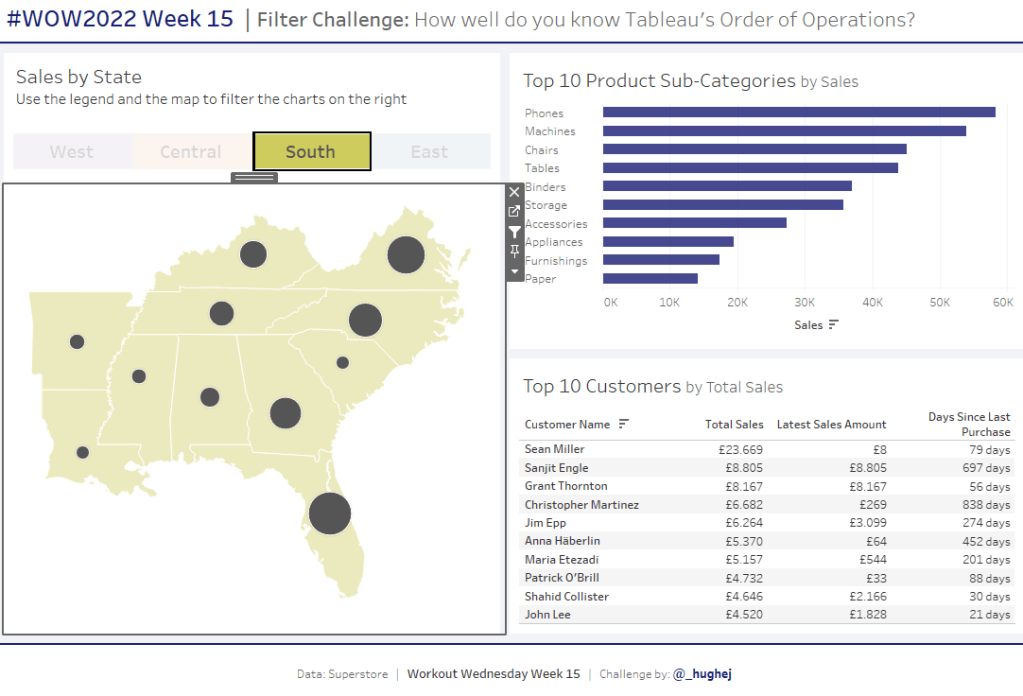
Erica Hughes asked the participants to recreate a comparatively simple dashboard were the users could click either on a region button or a state on a map and two top10 lists would filter correspondingly:
Now, anyone who has ever touched upon the order of operations, which basically means anyone that has ever done any top n lists, will already have a clue where this might lead us to. However, there is one more challenge up the hill that we will tackle.
But lets get going:
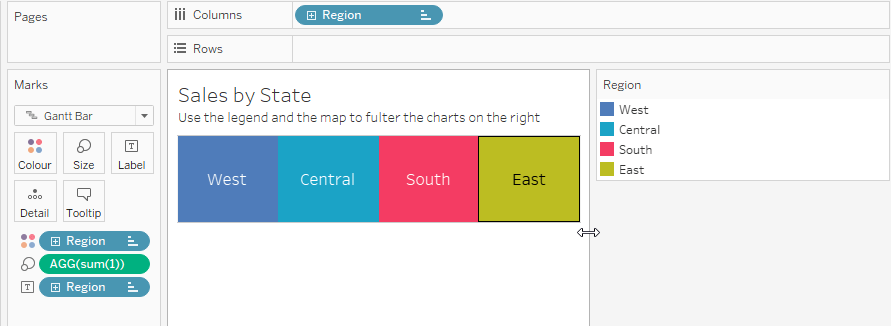
For the upper left chart, create this (yes, I am using different colours than Erica..)
The map consists of two layers:
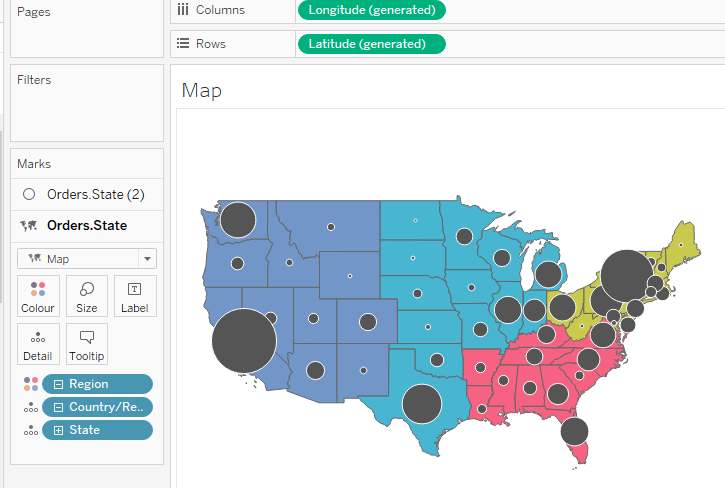
The first layer consists of the states. Start by dragging [States] from the data pane onto your sheet, then set the marks type to map. Next, put [Region] on the colors.
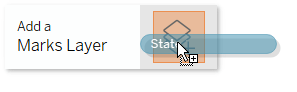
Following, drag [State] again onto the sheet to create a second layer:
This layer you can leave as circle. Put [Sales] on the size mark, adjust a bit as you see fit and we are done with the map.

Now, we create the third sheet, the top 10 list for our sub-category products.
Start with this:
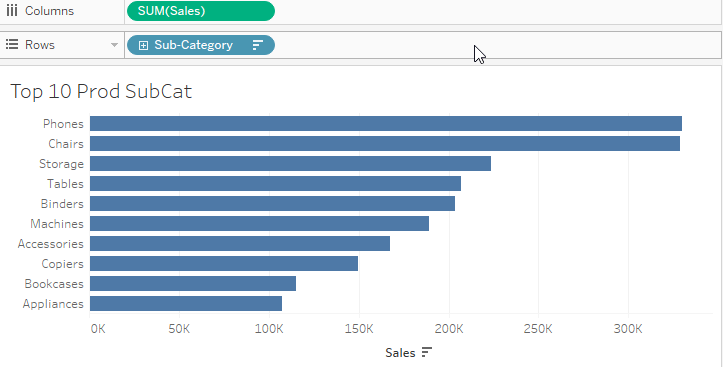
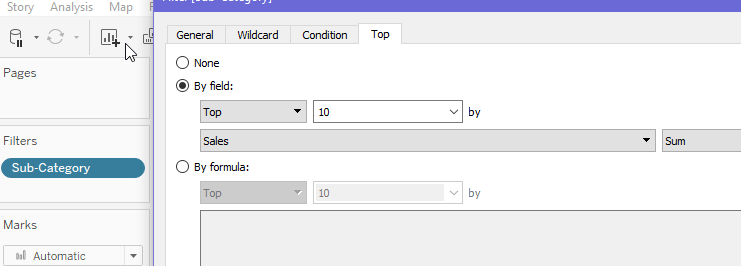
Then, add [Sub-Category] onto your filter shelf and go to “Top” condition, set to Top 10 by sum of sales
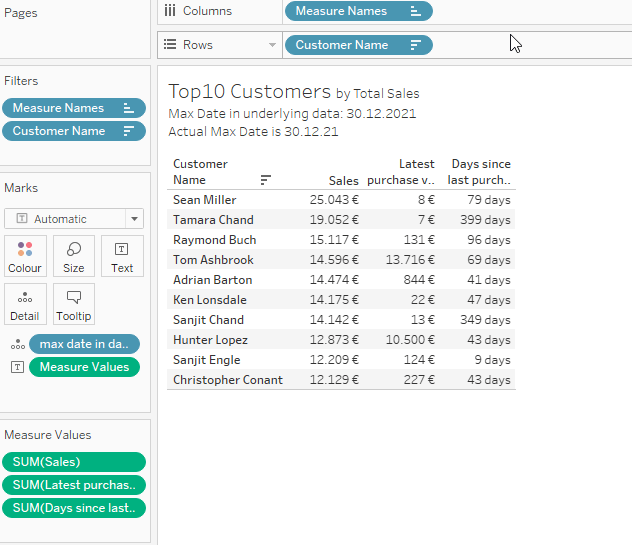
For the top 10 customer table we proceed basically the same just with [Customer Name] instead of [Sub-Category] but we need to create some calculations.
Erica wanted that the table shows days since last purchase and the corresponding sales for that last purchase where the days since… are defined not relative to today but relative to the max date in the data set (hint: it is 30.12.2021 as per Tableau 2021.4 sample superstore data).
Calculations for Top 10 customer table
So, first let’s establish the maximum date in the data set. We do this by using a table-scoped Level of Detail calculation:
//max date in dataset
{ max([Order Date]) }
This calculation just returns the maximum order date it can find within the entire data set.
Next, evaluate the last order date on a per customer basis. Again, we use a fixed level of detail calculation:
//Latest purchase Date per Customer | FIXED
{FIXED [Customer Name]: max([Order Date])}
Basically this reads “for every customer name, give me back the maximum order date”.
With these two calculations we can now establish the days since the last purchase
//Days since last purchase per customer
[max date in dataset] - [Latest purchase Date per Customer | FIXED]
So far, so good. Now let’s evaluate the latest purchase value
//Latest purchase value per customer
IF [Order Date] = [Latest purchase Date per Customer | FIXED] THEN [Sales] END
Notice that the last two calculations are row level calculations. A fixed LOD basically returns an (invisible) column into our data base with the calculated value which is why we can work on a row level and thereby evaluate row by row if [Order Date] is equal to the max date in the data set on a per customer basis.
Put these measures onto your table and you will get this (Customer Name filter is set to Top 10 by Sum of Sales just as the Sub-Categories before)
Creating the dashboard
Put all these sheets on a dashboard
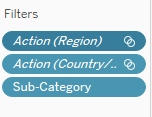
Ok, but we are missing the actions.
Go to Dashboard –> Actions and create two actions
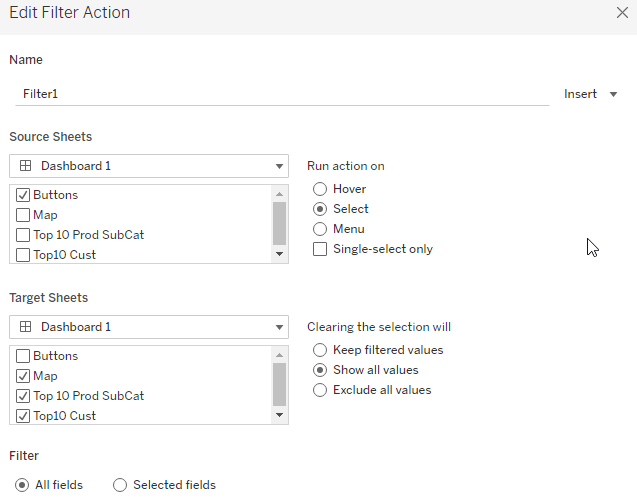
Filter Action 1 will be triggered by our buttons and filter all other sheets. We can leave “All fields” selected since we only have [Region] as a dimension by which we can filter
The second action is like this:
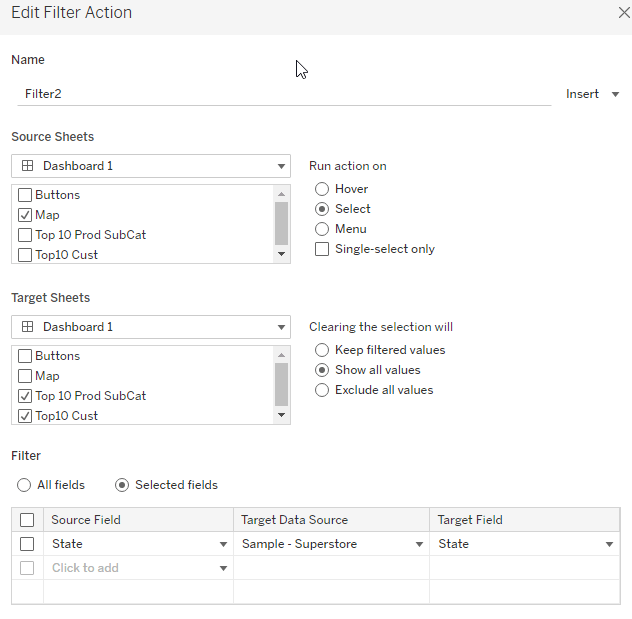
Notice that this time we are not filtering our buttons but use the map to only filter our two top 10 lists
Now when we click the buttons or a state on the map, we filter our sub-category list and our top 10 customers
But what is this?
If we now click for example Minnesota, there are suddenly only 8 sub-categories in our bar chart and even worse only one customer? How can this be?
The answer lies in the order of operations; so finally, we are at the topic.
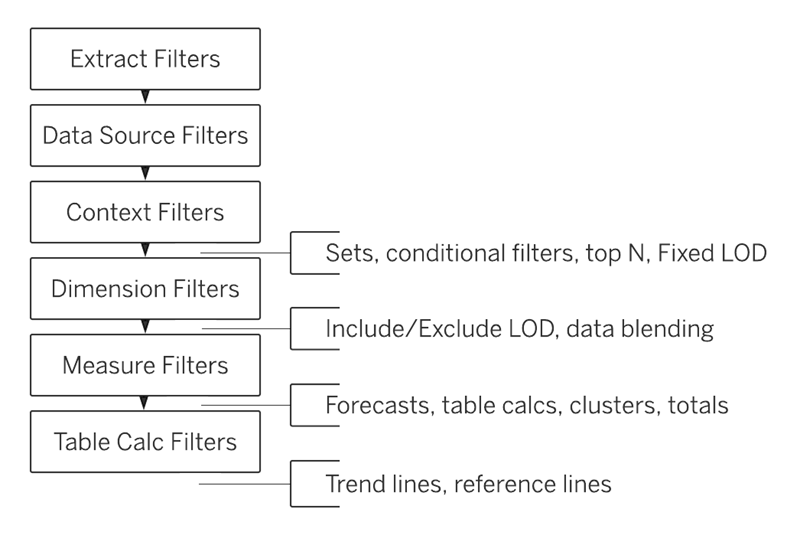
As we can see, conditional and top N filters come before Sets and dimension filters. And unless we do something about it, our just declared action filters are Sets as can be seen from the two rings at the end of the pill.
What happens is that we have Tableau first evaluate the top 10 and then filter that down in this case to Minnesota. So our one customer in Minnesota tells us that out of the overall top 10 one is in Minnesota.
But that is not what we want, we want to have the top 10 product categories and the top 10 customers per state or region, respectively.
So what we need to do is change both filters to context filters. To do so, right click the filters and select “add to context” – don’t forget to do this on both affected sheets.

What this does is that Tableau will first filter the data down to what is selected and then evaluate the top 10 based on the available data instead of the other way round.
So, now that we have done this, we are done, right? No, not quite.
There is still one caveat left
Check out what happens if we select South region for example.
This is what we get:
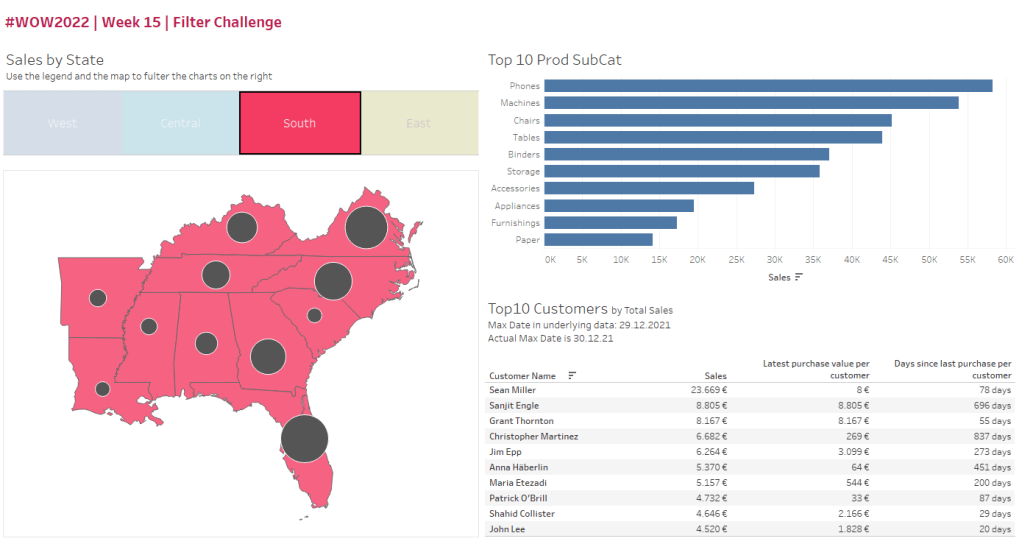
Now compare this to what Erica shows. Hint: check the days since last purchase:
We notice that all our days are off by one day.
Why is that? I have outlined the reason already in my Top 10 Customers sheet. Look above, there is two lines stating the “actual max date” which I told you already is 30.12.2021 and then there is another line that states “Max date in underlying data: 29.12.2021”. So this explains why we are of by one day.
But why is that? Again, the answer lies in the order of operations. Since we changed our filters to context filters, these are now applied prior to our Max Date LoD calculation because a FIXED LoD is on the same level as Top 10 filters.
And in the South region, the max date is not 30.12.2021 but the 29th.
But we want to compare to the max date of the entire data set. How do we do that?
Apparently, there is not much we can do. Because either we screw up our top 10 or we unintentionally fiddle around with the max date.
So, we have to somehow “hard code” this date. This could be done by either really setting it up hard in a calculated field and then reference that one instead of the max date LoD or we could use a parameter to store the date and reference that one. The latter is what Erica did.
You might have this parameter be updated based on a calculated fields every time the workbook opens based on your LoD so in case you have a dynamic data set, this will always default to the latest available data.

Assuming you have opted for the parameter solution, we have to adjust one of our afore formulas:
//Days since last purchase per customer
[max date in dataset] - [Latest purchase Date per Customer | FIXED]
Now becomes
//Days since last purchase per customer
p.max_date - [Latest purchase Date per Customer | FIXED]
So, with that we are done, we have successfully mastered the challenge.
But is there not another option how we can solve this? Let’s find out in Part 2 of this mini series. See you there.
Until then I hope you found this useful and as always, appreciate your feedback.
Until next time.
Steffen

Leave a comment