Assume you are creating a chart with some bars on it showing absolute sales and the corresponding percentage of the overall value.
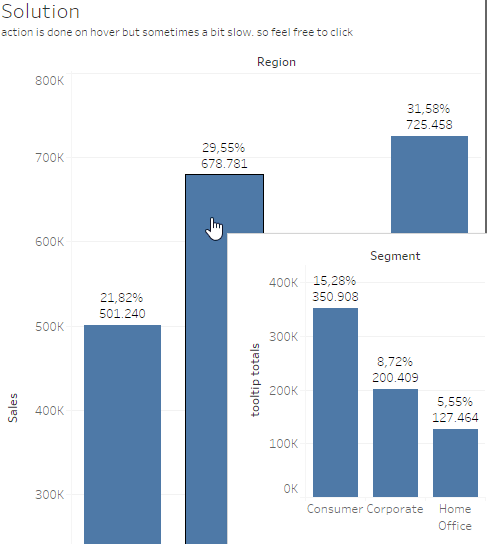
So, in sample-superstore terms you have four bars, one for each region. When you hover, you want to show the segments that make up that bar. Like this:

As can be seen, the percentages in the tooltip now add up to 100% because the tooltip shows the percentages of total after the Region = East filter has been applied:

But what if you want the tooltip to show the percentages relative to the total sales, not the filtered down sales? I.e the percentages shall add up to the 29.55% the East region stands for.
Adjusting the tooltip
We will use a parameter and two calculated fields to achieve what we aim for. Further, we will adjust the tooltip setting on our bar chart sheet But lets get started with recreating the problem:
Start with creating the bar chart:

Set the table calculation (percent of total from the quick add table calc menu) to compute table across in this instance.
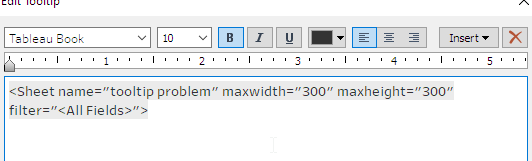
Next create the tooltip sheet that we will add on our first sheet in the tooltip:

Add this to the tooltip in your first sheet:
So, now we have created the problem.
Let’s move to the solution.
Create a parameter:

Create the following two calculations:
//Tooltip Percentages:
sum(if [Region] = [p.take_value] THEN [Sales] END) / TOTAL(SUM([Sales]))
//Tooltip totals
sum(if [Region] = [p.take_value] THEN [Sales] END) With that, we have all we need.
Adjust you tooltip sheet to this. Note that we have to put the tooltip totals field onto the rows This is needed because we will be removing the filtering from the tooltip and thus, if we simply kept the [sales] field on the view our tooltip would show incorrect totals.
Also note that I have removed the filter set from the filter shelf
Now, on your main sheet adjust the tooltip as follows:

We have removed the filtering function and will no longer transfer the Region as a dimension filter to the tooltip sheet.
Final step is to create a dashboard action where we send the hovered region value to the parameter:

The parameter will now trigger our calculated fields and we get what we want:
And with that, we are done. Find the workbook on my tableau public if you want to follow along.
I hope you found that useful. As always appreciate your feedback.
Until next time.
Steffen

Leave a comment