Heavens, time is flying by, isn’t it? Already time for a new blog post.
Since I am somewhat short on time these days, I just have a quick one to share.
Assume your task is to provide your sales management with an overview that allows them to easily figure out how often it takes a specific sales person longer than the allowed time in between closings of new deals.
For ease of replication, we will be using sample superstore and pretend that the customers are our sales persons and the orders are the sales.
Limit your data to these sales people (customer names..) as they have a several orders / deals:
Bart Pistole
Ben Ferrer
Chloris Kastensmidt
Emily Phan
Erin Ashbrook
Eugene Hildebrand
Joel Eaton
Noel Staavos
Patrick Gardner
Sally Hughsby
Suzanne McNair
William Brown
Xylona Preis
Zuschuss Carroll
As is customary here on my blog, I will be giving a solution that can be done in Tableau natively for the simple reason that from what I am seeing there is a significant amount of analysts out there that have no way of modeling or relating their data.
I am fully aware that there are easier options if you are able to play around with your data model.
But then again, this one isn’t really complicated either.
Let’S get into it
The first thing you need to do is to create a calculation that checks if the days since the last sale are higher than the allowed threshold. If so, we mark that date of sale with a 1, else a 0. Please do not forget to also create a parameter that carries the threshold value.
//counting | days since last purchase
IF min([Order Date]) - lookup(min([Order Date]),-1) > [p.test_cutoff]
THEN 1
ELSE 0
END
Create a sheet:
- Customer name (sales person name) on rows.
- [counting | days since last purchase] on text mark.

Right click the [counting..] field, edit table calculation, specific dimensions and set “restarting every” to customer name.
On the screen above I have put the min([Order Date]) – lookup(min([Order Date]),-1) for explanatory reasons just to show that we do not face a problem on the first row as this will always evaluate to null.
Next, we slightly change around our sheet layout and create two more calculations as all we want is simply the overall count per salesmen, not the individual sales dates and their evaluation.
//sum of counting
window_sum([counting | days since last purchase])
this will create the sum of all the 1s per salesmen that we just evaluated.
Move our order date from the rows to the details shelf.
Swap the [sum of counting] calc for what we previously had on the text mark.
Again, edit the table calculation. Make sure your inner calc (counting |…) is set up as discussed before and the outer calc is set to specifc dimensions and customer name is unticked. I.e. we partition by customer name.
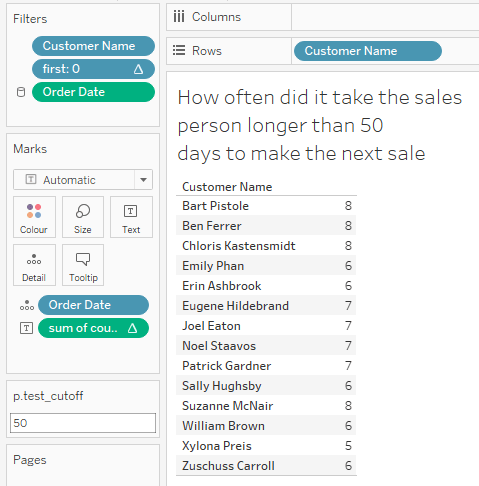
Finally, create a “first()” calculation, put it on the filter shelf, edit table calculation, specific dimensions, untick customer name. Then edit filter and only tick the 0 (zero).
And this is what we get:
Obviously, we can now play aorund with it, for example creating bar charts that show the overall amount of closings achieved per sales person vs how many took too long.
And with that we are done.
As I said, just a quickie for this time but maybe still helpful for some.
I hope you found that useful and as always appreciate your feedback.
Until next time.
Steffen

Leave a comment