Histograms are the go-to solution when you want to show distribution frequency.
Thus, no wonder Tableau offers an out-of-the-box solution for this where you can either have Tableau auto-detect / suggest bin sizes or you can manually set them or your are even free to use a parameter to adjust your bins on the fly.
Then, there are multiple solutions on how to enable grouping above a user-defined threshold to avoid situations where a few outliers leave you with an endless tail of empty bins.
what if filtering your histogram will make your currently used bin sizes meaningless?
Assume you have a 10-bin histogram in steps of a 1,000 but now you filter down to a sub-segment of your data and boom, what looked great and made sense before now has an empty tail again? Or vice versa, you build your histogram on a filtered data subset and when you unfilter you find that your bin count has tripled because your previous bin-size of a 1,000 per bin just does not cover the entirety of your now unfiltered data set?
On a dashboard that might lead to bad user experience when a histogram that had 10 bins now suddenly has 30 and becomes unreadable.
You might use a parameter and the user will have to readjust manually every time they filter but that is a) one additional step, b) the user would have to play around with the parameter until the bin sizes have been set in such a way that they become readable again. Maybe not the best user experience we can offer.
making your histogram self-adjusting
For this exercise, we want to create a histogram that gives us the number of orders binned by corresponding sales value. I.e. if Order 1 had a total sales value of 100, order 2 hat sales of 200 and our bin size is 100, then we would see 1 in each of the two bins.
PreparatOry works
Since we will be using sample superstore we need to do some minor prep works meaning we need to write a small fixed level of detail calculation to account for the fact that each order can consist of multiple products.
Since each product has its individual sales value attributed and we will be doing the binning by the sales that means that an individual order number with two products would possibly occur in two bins which is not what we want. The following screenshot will clarify:
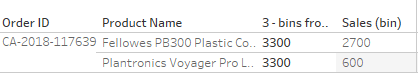
We see one order id with two products. The next column shows that when we use our level of detail calculation, both products belong to the same bin of 3,300 which resembles the overall value of the order. However, when we derive the bins from sales directly, we would see the order id in two different bins, being 2,700 and 600 respectively.
So, with that being explained here is the small calculation:
//sum of sales per order id
{FIXED [Order ID] : sum( [Sales] ) }
create two parameters
First, we need to define the upper boundary, i.e. our last bin. To make this also dynamic, we not only create a calculation but another parameter, p.percentile. Select float, range 0 – 1 and set to 0.9 for the beginning.
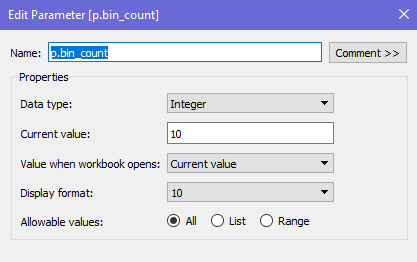
The second parameter will enable us to select the number of bins we want to see – this will be kept constant unless the user decides to change the bin count. We use an integer for this one and call it p.bin_count
creating the histogram calculations
Next, on to some more calculations. In a first step, we need to limit the sum of sales values at the selected percentile:
//ceiled percentile
min([sum of sales per order id], {PERCENTILE([sum of sales per order id], [p.percentile])})
This will give us a ceiled value which is either value corresponding to the percentile we selected in our parameter or the sales value, if the latter is lower.
Our second histogram calculation will define the size of the bins
//bin size
({PERCENTILE([sum of sales per order id], [p.percentile])})/ ([p.bin_count]-1)
Note that we subtract 1 from our selected bin count because the last bin will always be defined by the selected percentile.
Our last calculation is the bins (well, second to the last we will create one more but that is only for optics):
//bins
int([ceiled percentile] / [bin size]) * [bin size]
In this calculation, we create the bins as follows: first, we take the ceiled sales value, say 100 and divide that by our bin size, say 138. The INT() part then rounds that down towards the next full integer towards zero which is in this case: zero. A sales value of 200 divided by 138 would give us 1. Then we multiplicate these full integers with the bin size and thus create the bin values. The first bin therefore is always 0, the second starts at 138 and so on.
You may have encountered that histogram bins are sometimes hard to read for your audience because they usually give you the lower end. So, to cope with that here is our final string calculation:
//bins string
IF round([bins],2) = round({PERCENTILE([sum of sales per order id], [p.percentile])},2) THEN str(round([bins]))+'+'
ELSE str(round([bins])) + ' - ' + str(round([bins] + [bin size]))
END
The rounding is needed because just like Excel sometimes there seems to be a mismatch at the one-millionth digit and thus the first condition would never materialise as true which obviously we want.
Create the vis

Create as shown and make sure you put Regions filter into context. This is needed as we are using table scoped level of detail calculations in our percentile calculation. On a side note you might wonder: would that not affect also our calculation [sum of sales per order id] ? Answer is a clear yes but in this case it does not matter since every order is attributed to only one region within the data set.
This calculation
window_max(max([ceiled percentile]))is an ad-hoc calculation that i use to inform the user about the value that is derived from his selection (the x-Percentile value).
Next, put everything onto a dashboard and show parameters [p.bin_count] and [p.percentile] and the [Region] filter
And that’s it.
Your users can now select the percentile and the number of bins and the histogram will adjust as needed, always keeping the 90% percentile (but respecting the selected filters)
One more hint: if you do not put the filter to context, then your users would keep the bins based on the entire data set which might also be an effect you would want to show instead of adjusting the bins automatically size wise.
Find the workbook on my tableau public.
And that’s it for today. I hope you find that useful.
As always, appreciate your feedback.
Until next time.
Steffen

Leave a comment