For today I have an interesting one.
Let’s assume we are faced with a request where the circumstances allow you to show a maximum of twelve bars in your chart. Reason isn’t relevant, let’s just stick with that as a prerequisite.
At the same time, you are tasked to provide the most conclusive yet granular insight into the data and the users shall be free to select any years they want. And, your UIUX team wants you to do this with as little user interactions needed as possible.
So, this means:
- we only want to have one filter that the user can select from. He should not be required to make any additional inputs.
- The granularity must automatically adapt to never exceed the 12 bars.
The first idea might not prove helpful
Now the natural “instinct” might be ‘I will use a parameter for this”. This, however, has some downsides to it:
- Parameter does only allow single select
- A parameter does not encompass “all” option unless specified in the source list which means that either you are using a hard-coded yearly list and add ‘all’ to it or you have to come up with some workarounds on how to add “all” to the list (search Rosario Gauna or the Flerlage Twins for how to do this).
No. 1 is already what hinders us in using a year-parameter so let’s skip this for now.
Defining what we need
In order to achieve what we want to do we have to play around with the order of operations and use quite some tools from our toolbox.
Let’s see in general what we will need:
- A means on identifying how many years have been selected to define the granularity level
- A date field that adapts to the granularity
The problem we will be faced with is that our granularity is defined based on the filters so we are talking two different levels here. The granularity must be adapted on the row level in the data source so that Tableau then can aggregate based on that level. However, the defining moment comes after the filtering and aggregation has already been done.
How do we break this somewhat circular reference?
- Using a parameter
- Using an extension
And with that, we have now defined all elements that we will need. Still, the calculations are missing.
Skinning the cat (not literally!)
Start by creating a string parameter that accepts all values. This will later serve to tell our date calculation the granularity.

Next, we will be creating three calculations.
Calculation one is our date that we will set to be on the level of granularity we want.
//Date_sv
DATETRUNC([Parameter 1], [Order Date])
Calculation two is our trigger that works in calculation three later on:
//trigger_sv
{EXCLUDE [Date_sv],DATEPART('year', [Order Date]) :
    SUM( { countd( YEAR([Order Date]) ) }  )
          -
    COUNTD( YEAR([Order Date]) )
}
This may look kinda scary and most likely will require some explanation so let’s break it down:

The part highlighted in green is a table scoped (i.e. across the entire data set) level of detail calculation. All it does is to return back the distinct count of years in the data set. So, for sample superstore, this is 4 since the order years are 2019 to 2022 (using sample superstore 2022).
You can envision level of detail calculations to (invisibly) write back a value as a separate column in your data base. So, this part would put the value of 4
The yellow part will return back the number of years in the view after filtering. We are making use of the order of operations where FIXED / table scoped Level of details calculations come BEFORE dimension filters (i.e. the results are unaffected).

Why do we have to sum our fixed level of detail calculation?
Give it a try and you will see an error saying “can’t mix aggregated and non-aggregate arguments”

The reason is that the second part is an aggregation that is defined by the view’s granularity whereas the first part, our fixed level of detail, is independent of that granularity. So, to put everything back onto the same level we have to wrap our table scoped level of detail / fixed level of detail in an aggregate.
Since the LOD we use here is at a coarser level of detail (it’s as coarse as it gets since no dimensions are specified) we can wrap it in any non-counting aggregation we like, be it sum, min, max, average or median.
See here for an explanation.
What is the blue part for?
We will be putting the year of order date onto colors (that is just design) and our newly created date field onto the columns.
This however affects the VIEWS granularity which is now at the level of [Date_sv] and Year([Order Date]).
This means that the calculation part highlighted in yellow will be sliced by this granularity so the count distinct of the years will be done for every combination of [Date_sv] and Year([Order Date]).
This implies that we would have only one distinct year per sliced dimension (for 2019, we will only find 2019, for 2020 only 2020 etc).
The following screenshot highlights the issue. Our trigger as defined above with the exclude function ignores [Date_sv] and Year([Order Date]). Thus, our fixed count distinct of order years is 4 – 4 = 0 whereas if we do not exclude the dimensions in the view as in trigger_sv(copy)we return 3 as the result for 4 – 1 for every row in the view.

Therefore, we exclude the dimensions from our calculation.
The smart and charming part is now that we have the first part of the calculation that comes BEFORE the dimension filters but the second part comes AFTER the dimension filters but at the same time, both calculations are at the same level of detail.
So far, so good. We now are correctly calculating the delta between all years in the data set and the number of selected years.
Therefore, we can finally come to calculation three:
//para_feeder_sv
if sum([trigger_sv]) = 3 THEN 'month'
elseif sum([trigger_sv]) >=1  then 'quarter'
else 'year' end
When our trigger equals 3 this means we only have one year selected, thus our granularity shall be month. If it is 1 or more (note that the if clause stops immediately if it finds row 1 to be true, thus no extensive “in between” calculations are needed) that means we have selected 2 or 3 years and thus the granularity shall be quarter (3 years times 4 quarters fulfills our condition of 12 bars max). Else, if none of the afore holds true that means that we have selected all years and thus our granularity shall be years.
Create the view
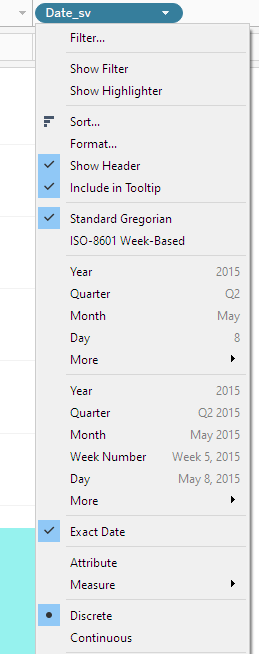
Put our [Date_sv] field on columns and make sure you set it to “exact date” (this will enable us to to the selected granularity)
Put sum(Sales) on the rows, year(Order Date) on the filter shelf as well as on colors and put our para_feeder_sv field on the details.

Now, we still need a means to convey our selected granularity to our [Date_sv] field.
We cannot directly use [para_feeder_sv] it in the [Date_sv] as it will throw an error stating that the calculation needs a string literal.
We circumvent the problem by creating a dashboard, moving the sheet there.
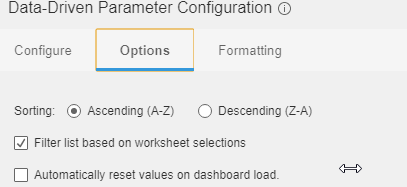
Then, add an extension and select “data-driven-parameter”.
Configure like this (there won’t be any other choices anyways):

On the second part, Options, make sure you tick the top box. The rest can remain untouched:
And with that, we are done.
Here is the workbook on my Tableau Public.
I hope you find that useful.
As always, appreciate your feedback.
Until next time.
Steffen

Leave a comment