The challenge
A returning question on the forums is when users want to take the results of filtered table calculation(s) as a fixed value or value set to another sheet.
A recent example was when a user asked how he could maintain a Top 10 ranking for webpages based on their viewings. The Top 10 were derived based on a user defined time selection (filter).
He then wanted to transfer these Top 10 webpages into another sheet where the filter that led to these ten being selected did not exist because he wanted to show the webpages’ monthly views over their entire lifetime.
From the outset by definition carrying over these results is not possible. Either, data is filtered or it is not. You cannot be wet and dry at the same time. However, thanks to the work of many smart people we will be answering this challenge using the Sample – Superstore dataset and analyse products.
The issue with Top N
Essentially, there are four options of how to derive dynamic Top N rankings:
- Create a set, select Top N and define the field.
- Use a Filter and proceed as before
- Use a rank table calculation
- Use index table calculation
Whether by Context or Dimension, at least one filter that defines the environment within which the Top N is derived is usually present. The two following screens will clarify the challenge.
On Image 1 we got the product name filter that is set to show Top 10 by sum([Sales]).
Then, we got the time filter at monthly granularity. It is set to context to be considered prior to the top 10 filter. Check out the order of operations when in doubt why that is.
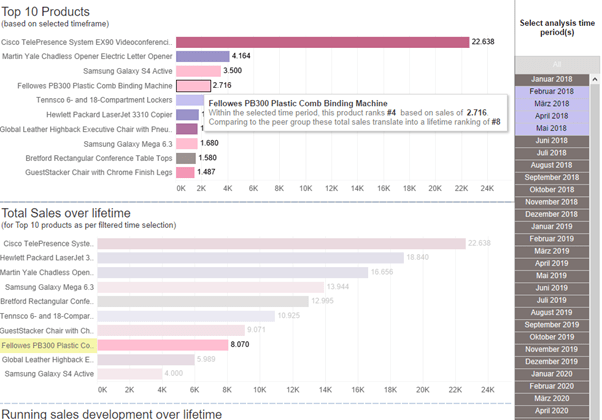
So, this gives us the top 10 products by their sum of sales for the time period February 2018 to including May 2018. Screen 2 shows what we get without the time filter set.
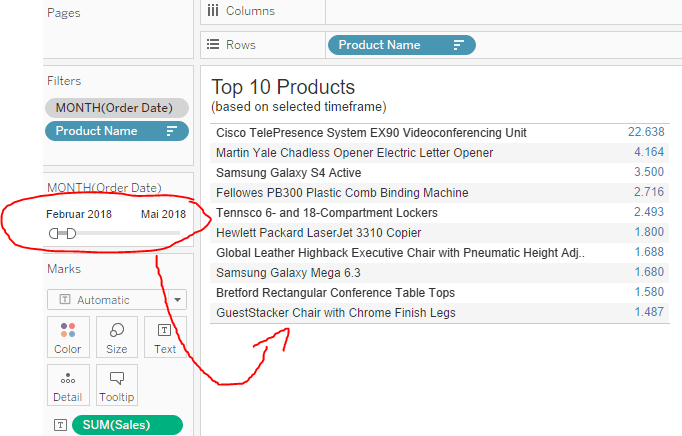
Image 1: Top 10 Products based on selected months of order date 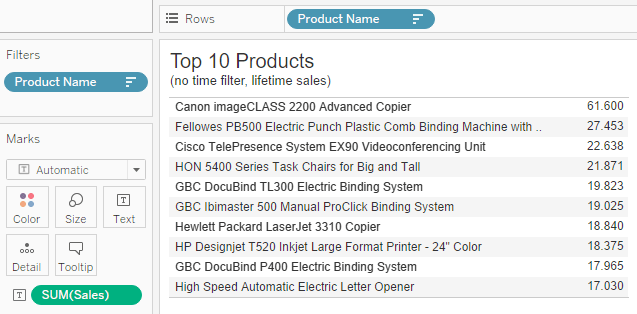
Image 2: Top 10 products by lifetime sales.
As you might figure, these 10 are not the same items as the top 10 by the defined date period. In fact, only two products match:

So how do we create Top 10 which are derived from a filtered source without filtering the source in another sheet, i.e. how do we carry over the Top 10 February to May to see these products’ lifetime sales?
Three options to achieve what seems contradictory
Option 1: Make use of Tableau Extensions
For this option, what you need is:
- Create two date parameters (p.MinDate, p.MaxDate)
- Two extensions on your dashboard -> Data Driven Parameter (sandboxed)
- A window_min and a window_max calculation
- A row level calculation
On your time filtered Top 10 sheet in which the Top 10 are filtered by Sum([Sales]), add
//Ad-Hoc Calc 1
window_min( min( [Order Date] ))

//Ad-Hoc Calc 2
window_max( max( [Order Date] ))
to the detail shelf.
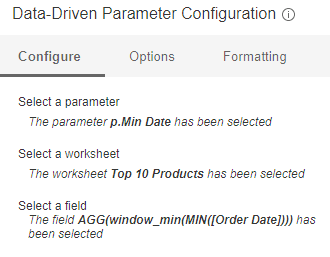
On your dashboard, put the two data driven parameter extensions. Configure one to feed the p.MaxDate parameter with the window_max calculation we just created and the p.MinDate to take the window_min.
On the Options tab, you need to select at least the first checkmark (Filter list based on worksheet selections) and setting the “automatically reset on dashboard load” does also not hurt.
All else can remain deselected. Unfortunately, this extension is not really well documented (or the documentation is well hidden).
In order to hide the extension from your dashboard as they can be distracting for the end users, put them in a floating container and narrow it down to 1x1px.
Or, alternatively, on the floating container make use of the show/hide button. Hide the container, then delete the show/hide button. The container with the extensions will stay, but it is invisible. This neat little trick was revealed to me by Paul Hebes on the forums.
Now, create the row level calculation at monthly granularity (this was the request)
//Sales in selected period | Monthly
IF datetrunc('month',[Order Date]) >= datetrunc('month',[p.Min Date])
AND
datetrunc('month',[Order Date]) <= datetrunc('month',[p.Max Date])
THEN [Sales]
END
From here on, just build your other sheet(s) and do a common Top N filtering but do not use Top N by Sum of [Sales] but rather by the just created Sum of [Sales in selected period | Monthly]
A pitfall to avoid
Be aware that when using date range filters on a monthly scale like in the above example, Tableau will usually use some more or less random days within the selected month. Even if you can’t really see it. This way, you might miss out on some data points.
Peter Fakan has just posted a step by step guide on August 19th 2021 how to make sure that the monthly date range filters actually only apply as per 1st of the month.
Check it out here:
Pros:
Simple to build, easy to understand
Cons:
Requires dashboard extensions which, even when sandboxed, some companies do not like / allow. Also, with min and max date the end user is not entirely free to select the timeframe he wants but it must be consecutive dates (thus, the range filter). Otherwise, results will be false.
But what if the user needs to be completely free in selecting the time ranges he wants to analyse?
We have two options. In any case, we must either tell Tableau which dates have been selected but without actually filtering or, second option, tell Tableau which products have been evaluated to be the Top 10 for the selected time periods (based on the filtering).
In both options, we will be building on a great blog post from Jonathan Drummey: http://drawingwithnumbers.artisart.org/parameter-actions-using-a-parameter-a-data-source/
And for option 3 we will also use parts that were explained in a guest post by Ethan Hahn on the FlerlageTwins Blog: https://www.flerlagetwins.com/2020/11/guest-blog-post-allow-users-to-export.html
Option 2: Store selected dates
Instead of using a filter, we will make extensive use of parameters and sets and corresponding actions to achieve what we want.
First, let us build out our month filter replacement.
Create a new sheet and put order date on rows, select Month/Year, select square from the marks card, put the Order Date at MY on label, deselect “show header” on the rows shelf.
We will come to the colouring etc later on but for now we already got our filter replacement sheet.
Now, what we need is quite a lot, but stay with me. Some parts are also for better user experience.
- Another parameter. Create a string parameter, name it p.Selected Dates.
- A calculated field that transforms our MY Date into a string (so we can later store it in the parameter)
//MY String
str((DATEPART('year', [Order Date])*100 + DATEPART('month', [Order Date])))- A calculated field that answers whether or not our parameter already holds the MY String value
//TF included in parameter
CONTAINS([p.Selected Dates], [MY String])- A calculated field that defines what we write to our parameter or if we delete something from it. When a user clicks the same date twice, he expects it to first select and then deselect again. Part 1 of the calc does the deselecting by removing the value from the parameter. Part 2 defines a delimited version of the MY String which will be added to what is already in the parameter.
//Write selected Date to Para
IF [TF included in parameter] THEN REPLACE([p.Selected Dates],"_"+[MY String],"")
ELSE

[p.Selected Dates] +"_" + [MY String]

END- And yet another calculated field that checks if the parameter is empty. This will be needed for our additional “All” that we will add to the time selection to provide the user with the original filter look and feel.
//TF All
[p.Selected Dates] = ""- And one more calculated field for toggling
//Toggle All / Empty
IF len([p.Selected Dates]) > 0 THEN "" ELSE "_200001" END
//_200001 is a fake value that will remain in the parameter but does not hurt- A custom date for monthly granularity
//Date by Month
DATETRUNC('month', [Order Date])- And finally, a Set that is defined by a formula and created from the afore Date by Month custom date
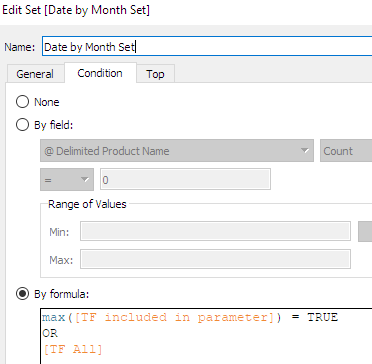
Can you see how all this comes together? We use the parameter to hold our values that feed the set. Since we can only concatenate strings to pass to a parameter, that is why we create the MY String calculation
In order not to bolster the parameter with double entries and to enable deselecting of months, we check whether a string value already exists in the parameter and if so, we remove it. Then we use the string that is stored in the parameter to define a set that returns us the corresponding dates.
Now for the “All Dates” part
Create a further sheet named “Select all’”. Put an ad hoc calc named “All” on labels, set marks field to square. Put the Toggle All/ Empty on details.
To adequately color the “all” button, we cannot use the set we created. We must create our final calculated field which checks if we have manually selected all dates (in which case the user would expect the “all” button to also be highlighted, just as he is used from the real filters) or the “all” button. Since this would be the longer way, we just check the inverse.
//Color All
IF  {countd( IF [Date by Month Set] THEN datetrunc('month',[Order Date]) end)}

!= ({countd([MY String])}) THEN "NOT ALL"

ELSE "All"

END
If the number of items in the set is not equal to the number of different MY Strings then we didn’t select all. If it is equal, the check is false and we revert to the “ELSE” part.
The “all” button will completely fill the set so this calculation will not be true anymore, thus fall to the ELSE part of the calculation.
Time to move to the actual dashboard. Put all the needed sheets on your dashboard in a way you like, that is the time filtered Top 10 sheet, the filter replacement sheet (in my case called “Date Select”) we created and the sheet(s) were you want to use the Top 10 without filtering by time.
Done with that? Great, we are almost there. All that is left to do is create two or three actions.
Needed is a Parameter action writing the select date value to the parameter.
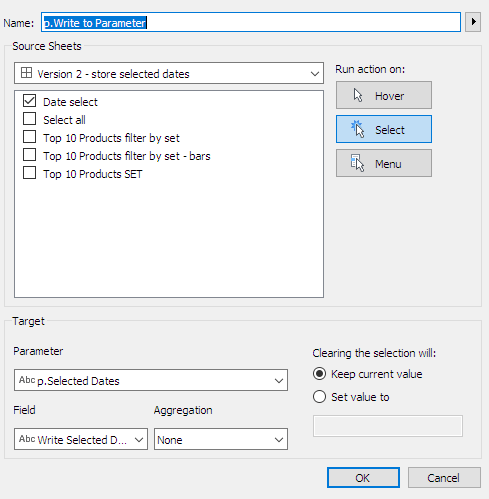
Another Parameter action for the “all” toggle button

Finally, a simple highlight on hover action by product name gives a great visual to show that really the 10 products are the same.
Et voila, version 2 is done, looking for example like this
Pros:
- Kinda hacky solution.
- Selecting the dates feels natural to the user.
- Date selection can be made a visual catch and even add to user experience.
- We can freely select any dates we want and the results will be correct, no need for consecutive dates.
Cons:
- Kinda hacky solution
- Not a real filter. Sometimes, people prefer real filters
- Selecting dates can be slow and you can only select one at a time
- Not feasible for very long range of dates or finer granularity.
Option 3: Storing the resulting products
Instead of storing the dates in a parameter and based on these artificially rebuild the Top 10 to derive the products, why not store the results of the Top 10 calculation in the first place?
This way, we can even use a real filter.
In the end, its up to you. We will proceed again with the end user in mind. What that means will become clear in a second.
To start, create a new sheet. This sheet will become our filter sheet from where we pass the filter values to our initial time based Top 10 sheet.
Also, we will be using this sheet to create the string that holds the resulting Top 10 product names which we then pass to our new parameter, p.Top N Products
You may ask why don’t we directly filter our initial sheet? Answer: user experience. In my mind, it would feel odd for the user to select filters which only affect one sheet and then having to click a button to transfer the effects onto the other sheets.
Therefore, we create just one single “apply” button which we can use to pass the filters as well as initiate our parameter action.
On this “apply filter” sheet put everything you need for the Top10 calculation as well as your filters on the details.
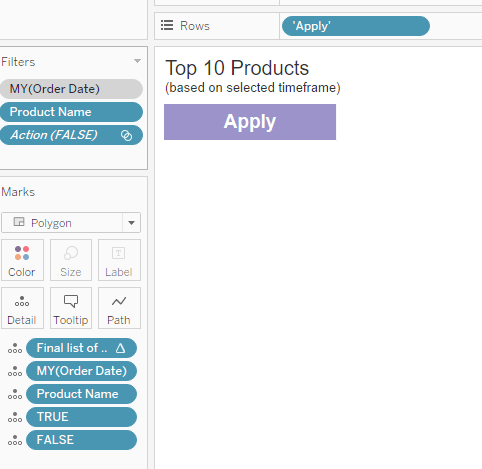
Basically, you have to mirror the Top 10 by selected time on the details. Put “apply” on rows, set mark to polygon.
Put order date (Month/year) on filters as well as product name (filter to top 10 by sum of sales). Remember that the MY Order Date must be in context to correctly return the Top 10 (cf. Order of Operations when in doubt).
True / False are for cosmetics, see Luke Stankes post on de-highlighting here https://www.tessellationtech.io/disable-highlighting-parameter-actions/
Now everything is already prepared for the filters to be passed but we still need the Top 10 results to be written into a calculated field from where we transfer it into the parameter. Therefore, create three calculated fields
//@ Delimited Product Name
"|" + [Product Name] + "|"
//@ List of Top N Products
PREVIOUS_VALUE(ATTR([@ Delimited Product Name]))
+
IF CONTAINS(PREVIOUS_VALUE(ATTR([@ Delimited Product Name])), ATTR([@ Delimited Product Name]))
THEN ""
ELSE ATTR([@ Delimited Product Name]) END
For an explanation of this calculation, refer to the aforementioned post by Ethan Hahn on the FlerlageTwins.com blog.
Finally, the calculated field that goes on the “apply filter” sheet (see above screen). Put it on the details
//Final list of Top N Products
window_max([@ List of Top N Products])
Next, create a set from the product names as follows
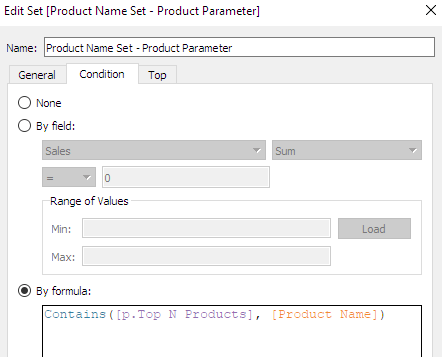
You can tell already this is getting similar to the dates approach.
Put this set on the filter shelfs of those sheets where you don’t want to filter by the dates but instead show the entire lifetime sales of the products. Set to In/Out and select “in” as filter value.

On your dashboard, add the “apply filter” sheet and put the MY of Order Date filter from that sheet on the dashboard. Now the user has a standard filter that won’t do anything unless we click “apply”.
Finally, create the dashboard actions
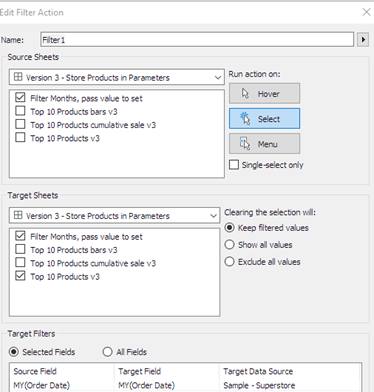
Filter action to pass the MY Order Date values to the sheet that is date limited (your original Top 10 by defined dates sheet):
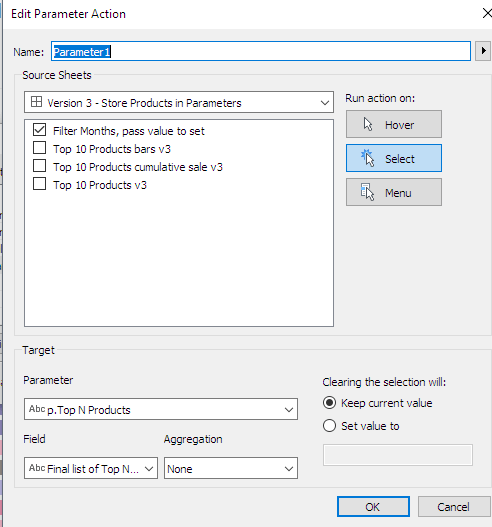
A parameter action where we pass the “Final list of Top N” to the parameter (which then feeds our set which then filters the sheets that are not time based)
And that’s it. Three options of how to do what is actually not doable.
If you want to follow along you can find the workbook here:
Thanks for reading and I appreciate your feedback.
Until next time
Steffen

a nice Solution 👍😃
LikeLike