The last one for 2023 is something I had on my mind for quite a while but never really got the time to do it: Creating a hierarchy filter in Tableau.

Until recently, there was not much on this issue; at least not that I’d be aware of. The only one I remember to have written a blog on this was Visionary Marc Reid back in 2020 and as he himself stated once, this was more of a technical idea, not really worth putting into actual use.
But, strange as life goes sometimes, right when I started working on this there was something popping up on my linkedIn feed and it was – who else would it be – Rosario Gauna presenting her techniques on exactly this issue, round about 1 week before I wanted to post my stuff.
Honestly, I was a bit like “for heaven’s sake, there has been nothing on this for years and now, right when I start, someone else comes up with this featuring a very elegant solution.” (there is a reason why there are Visionaries, I can tell you…).
However, when digging deeper into it I noticed immediately that maybe my technique still might be worthwhile to present as mine is quite different to Rosarios approach.
What we will be doing is creating a hierarchy filter, three levels, all natively in Tableau without any data preparation.
Thus, this technique might be something for you if you are working with data sources straight from server or cloud that do not permit you to add relationships or create joins.
The downside to my technique, let me state this straight from the beginning, is that it is a bit more work intense. But it is always good to have several tools up your sleeve anyways so I strongly suggest if you are interested, read my stuff, read Marc Reids and especially Rosario Gaunas.
My approach consists basically of two parts. The drill down and the selection.
Let’s start with..
The drill down part
The drill down is basically the menu on the left to which we will add the selection segments later on.
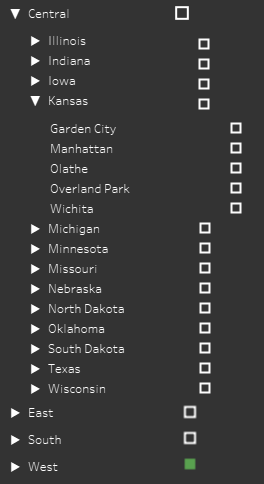
We want to be able to drill from Region (limited to US in my case) to State to City.
What we need is an option that our menu expands when we click on for example the Central region. Then, the other three regions need to move down and our States within the Central region need to show.
For those, the same applies. Clicking “Kansas” within Central region must open the third layer, showing Central with Illinois, Indiana, Iowa and Kansas on top, followed by the cities within Kansas and the other States then below that, followed by the three other Regions. This is what we must be able to show:
Since we are not using any data preparation (i.e. for example unioning to itself or relating a second table for densification purposes) this requires us to:
- create two sheets for Regions: Region Top and Region Bottom
- create two sheets for States: States Top and States Bottom
- one sheet for the cities.
Start by creating the region sheets and the following further steps:
- Parameter p.drilldown_region (type “String”, allow “all”)
- Parameter p.drilldown_state (type “String”, allow “all”)
- Parameter p.drilldown_city (type “String”, allow “all”)
- Parameter p.selected_entities
- Calculated fields
//Delimited Region - State - City
'Region:'+[Region] +'-'+'State:'+[State/Province] +'-'+ 'City:'+[City]+ '%'
//Drilldown toggle - Level 1 - Region
if [Region] = [p.region_drilldown] then '' else [Region] END//Drilldown toggle - Level 2 - State
if [State/Province] = [p.state_drilldown] then '' else [State/Province] END//Drilldown toggle - Level 3 - City
if [City] = [p.city_drilldown] then '' else [City] ENDFurther, we need to add some uiux parts so that our users are informed that they can drill:
//Region Arrows
if [p.region_drilldown] = [Region] THEN  "▼   " + [Region] ELSE "▶   "+[Region] END
// State Arrows
if [p.state_drilldown] = [State/Province] THEN "▼ " + [State/Province] ELSE "▶ "+[State/Province] ENDNext, we need filter fields for Region and State that help us show or hide the relevant top / bottom parts
//Region filter top
[Region] <= [p.region_drilldown]
//Region filter bottom
[Region] > [p.region_drilldown]
OR
[p.region_drilldown] = ''These we put on the corresponding sheets (Region top and Region bottom) and set them to “True”.
Add a calculated field “blank” on each of the sheets on details that is simply a double single quote –> ”.
Do the same calculations with States and the States parameter and put them on the States sheets.
For the States sheets, we need one more calculation that also needs to be set to true on the State sheets.
// Filter State by Region
[p.region_drilldown] = [Region]
Now, create the four sheets:


The last sheet we need to create is the City sheet.
This sheet is a bit different to the two previous ones. Since there is no further drill down beyond the cities, we will add some calculated fields also on this sheet, the siblings of which we will put onto our “selection sheets” for Regions and States later on.
So, for City sheet create these calculations:
- TRUE –> A simple calculated field with TRUE on it
- FALSE –> as before just with FALSE
- The drill down toggle should be created at this point already, see above.
//Marker - Level 3 - City
CONTAINS([p.selected_entities], [Delimited Region - State - City])
// Filter City by State
[p.state_drilldown] = [State/Province]With thise done, create the last sheet:

Create your dashboard / Menu
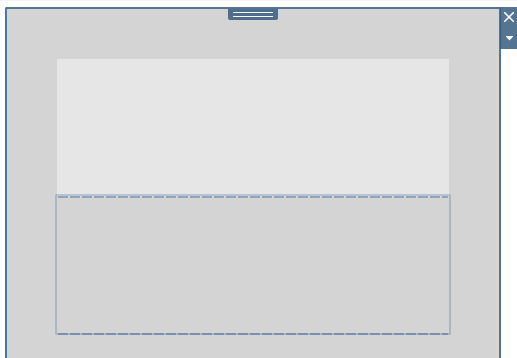
Create a dashboard, put a vertical container on the left.
Into this container, put five (5) horizontal containers.
Tip: if you are having trouble putting the horizontal containers underneath each other, select the first one you inserted, give it a background color. Then select the vertical container wghere you put the horizontal container in and put inner padding to 50.
This will make the horizontal container on the inside easy to recognize and make dropping the other containers much easier:
After all five have been created, you can undo the color and the inner padding.
Now continue with droping your menu sheets into the containers like this:

Go on and hide all titles.
Make the menu interactive already
Let us take the opportunity to make our menu interactive already.
Create the following actions:
For all of our levels create an action that runs on the two sheets (for Region and State) and the single sheet (City) respectively.
All actions are change parameter actions. The target parameter is the respective matching p.drilldown_xyz and the source field the matching drill down toggle calculation we created earlier.
Here is one example for Regions:

This will add or remove Regions to Region parameter, State to State parameter and City to City parameter.
Next, create two calculations:
//DynViz - show state
[p.region_drilldown] != ''
//DynViz - show city
[p.state_drilldown] != ''We will need these to dynamically show and hide parts of the menu.
Go to your dashboard and apply dynamic zone visibility as follows:
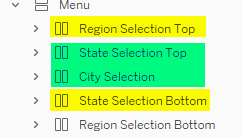
Yellow marked: use DynViz – show state.
Marked green: use DynViz – show city.
No marks: just keep as is.
This will make sure our menu expands and collapses. When nothing is selected, i.e. no State, we will only see Region Selection Bottom which, given that nothing is selected, will host all four regions.
When we select say Central, then the DynViz – show state becomes true and we show the Region Top container where it’s sheet filter limits the region to central. The bottom region container will also be shown but limited to Regions East, South and West.
Two further actions are needed that will make sure that when we drill up, we do not keep values from below levels.
Therefore, create a parameter action “Drill up – remove city” and select both state and both region sheets as source. Target parameter is the p.drilldown_city and the value to be passed is the “blank” field we created earlier.
Do the same but with p.drilldown_state as the target parameter and the region sheets as the source.
With this, the drill down and up functionality of your menu should be fully functional and we can therefore go on to
The Selection Part
We start by creating all the calcs we are still missing.
We start by creating the calculations we need in order to check if we have selected nothing, some or all cities within a region or within a state.
//Count of cities per region
{fixed [Region]: countd([Delimited Region - State - City])}
//count of cities per state
{fixed [State/Province]: countd([Delimited Region - State - City])}//count of selected cities per region
(LEN([p.selected_entities]) -
LEN(REPLACE([p.selected_entities], ('Region:'+[Region]),'' )))
/
LEN('Region:'+[Region])//count of selected cities per state
(LEN([p.selected_entities]) -
LEN(REPLACE([p.selected_entities], 'State:'+[State/Province],'' )))
/
LEN('State:'+[State/Province])These calculations define the overall amount of cities within a region or the state. Notice that I am taking the delimited version which is basically, due to combining the region, the state and the city, a unique identifier. The reason is that some cities exist twice in a region (e.g. bloomington is present in Central region in Illinois and Indiana).
The third calculation then check, how often a region is named within our storage parameter p.selected_entities. The fourth calculation does the same for the states. We then can compare if the number of Region “mentions” within our parameter equals the number of cities within that region or state.
We do this in our next two calculations:
//Marker - Level 1 - Region
IF [count of selected cities per region] = 0 THEN 'None'

ELSEIF [count of selected cities per region] = [count of cities per region] THEN 'All'

ELSE 'Some'

END
//Marker - Level 2 - State
IF [count of selected cities per state] = 0 THEN 'None'
ELSEIF [count of selected cities per state] = [count of cities per state] THEN 'All'
ELSE 'Some'
ENDMarker number three for the city level has been created already if you followed along closely.
The next calculation will be the one that adds or removes an individual city / the unique identifier to our storage parameter:
//ACTION TOGGLE - Add to / remove from Parameter
if CONTAINS([p.selected_entities], [Delimited Region - State - City] )

THEN REGEXP_REPLACE([p.selected_entities],[Delimited Region - State - City],'')

ELSE [p.selected_entities] + [Delimited Region - State - City]

END
This toggle will add the delimtied (unique) string to our storage parameter if it is not present, otherwise, it will remove the present string from the parameter (therefore: toggle).
However, we are not done yet as we are missing two things:
First, we need to automatically add all states and all the cities within these states, if a region is clicked. also, we need to remove all of them, if the region is unticked.
The same holds on the second layer: if a state is ticked, we need to select all cities within that state and remove them if the state is unticked.
For that, we need to define a list of all cities within region and states. We do so by creating a table calculation:
//List of cities per state and region
PREVIOUS_VALUE(ATTR([Delimited Region - State - City]))

+

IF CONTAINS(PREVIOUS_VALUE(ATTR([Delimited Region - State - City])), ATTR([Delimited Region - State - City]))

THEN ""

ELSE ATTR([Delimited Region - State - City]) END
This will give us a growing list of cities (unique identifiers).
But we need to have the final list – the maximum list with all cities included – available straight from the beginning. Therefore, as another step we need to wrap everything in a window_max function again:
//Final list of cities per state and region
window_max([List of cities per state and region])
Obviously, we will need to set the table calcs right later on.
With this done, let’s do our final two calculations that toggle between adding or removing everyting. The calculation will
//ACTION TOGGLE - Add/remove all Cities via Region
//Part 1, remove existing from direct selection when deselecting an entire region, keep the other regions

IF max(CONTAINS([p.selected_entities], 'Region:'+[Region]) ) THEN

        MAX(REPLACE(REGEXP_REPLACE([p.selected_entities], 'Region:'+[Region]+'[^%]*','>>')

, '>>%',''))

// Part 2, remove existing bits from possible direct selection via state, then add "final list" per state

ELSE MAX(REPLACE(REGEXP_REPLACE([p.selected_entities], 'Region:'+[Region]+'[^%]*','>>')

, '>>%',''))+[Final list of cities per state and region] end   //not possible to use regexp with table calcs
Assume we have East selected only partially we the selection done only considers three cities within Conneticut. Also, we have the South region fully selected.
We now need to make sure to – on region click – remove everything that is East related. This is done in Part 1.
The second part must make sure that we do not duplicate what is already present in the storage parameter when clicking East region again. This means, we must again first remove everything and then add our final list of cities.
For the state, we basically recreate the same:
//ACTION TOGGLE - Add/remove all Cities via State
//Part 1, remove existing from direct selection when deselecting an entire region, keep the other regions

IF max(CONTAINS([p.selected_entities], 'State:'+[State/Province]) ) THEN

        MAX(REPLACE(REGEXP_REPLACE([p.selected_entities], 'Region:'+[Region]+'-State:'+[State/Province]+'[^%]*','>>')

, '>>%',''))

// Part 2, remove existing bits from possible direct selection via state, then add "final list" per state

ELSE MAX(REPLACE(REGEXP_REPLACE([p.selected_entities], 'Region:'+[Region]+'-State:'+[State/Province]+'[^%]*','>>')

, '>>%',''))+[Final list of cities per state and region] end   //not possible to use regexp with table calcs
Now, we can create our selection sheets:
Create the four sheets for region and states (top and bottom respectively, make sure to take the correct action toggles and markers per level). Take care of selecting appropriate colors and shapes for the marker as per your needs.
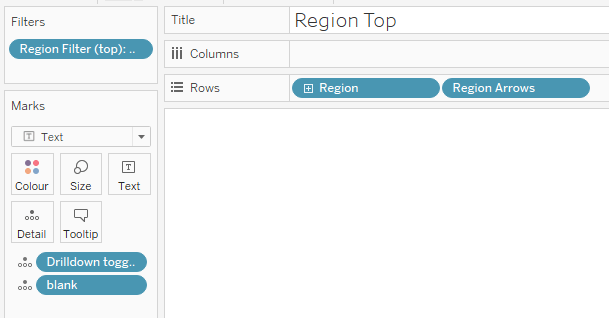
Here is an example for Region Selection Top. Take good note of the filters as well – these are the same as for the drill down menu.

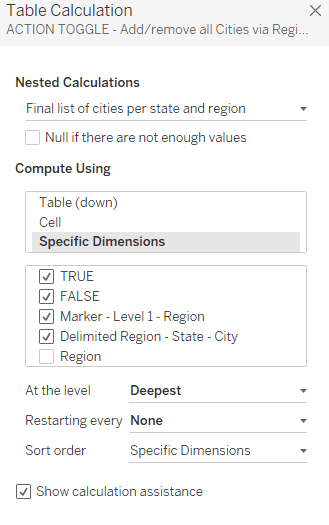
Make sure to set the table calculation on the ACTION TOGGLE to be partioned (unticked) by Region and adressing all other fields. Be careful, it is a nested table calculation meaning you must set it correctly for both.
You will notice I also have a “last” field on the filters pane. Create a alculated field, name it last and in it goes “last()”.
Put it on the filter, make sure to have it compute exactly as just shown and then set to 0 (zero) only.
Complete the menu with selections
Now what is left to do is to add the selections to your dashboard – remember we added horizontal containers.
Add them into the relevant containers, remove titles.
In the end, your layout should look like this:

Finally, add interactivity to your selection parts by adding these actions:

These are all structured the same. For 1 you need to select city sheet from the dashboard as the source, the p.selected_entities is always our target and the field is the corresponding action toggle calculation we created.
For States and Regions make sure to select the top and bottom selection sheets.

What is left to do now is to create whatever sheet you want to filter. The filter is based on this for example:
contains([p.selected_entities], [Delimited Region - State - City])Put on the filter, set to true.
Obviously, if you have the need you could also filter focussing only on region or state. Disregarding the exact unique identifier. That is depending on your requirements.
You may have noticed that we have “TRUE” and “FALSE” calculations on our details. This is sometimes needed to undo highlighting and I always add them.
But it seems in this case, they are actually not needed.
And that is it. Not the fastest way but an option to create a hierarchy drill down / filter even if you are not in a position to change (e.g. scaffold or union) your data model.
Find my workbook here:
Hierarchy filters – no data prep
As always appreciate your feedback.
Until next time.
Steffen

Leave a comment