Every now and then on the forums people are asking how they can provide their viewers at least to some degree the freedom to select the dimensions they (the viewers) want to make use of.
Instead of just having the choice of seeing sales broken down by Category and Order Date, maybe they want to be able to see it broken down by Category and Ship Date and Segment?
Depending on the number of dimensions at hand, it will be next to impossible to meet all combinations plus your workbook will quickly become almost unmaintainable
With that being said, here is what we want to provide our users:
A quick shout-out
What we will be building is based to a large extend on the works by legendary Hall of Fame Visionary / Zen Master Jonathan Drummey.
An option we won’t explore
The first option is to simply create several parameters and associated calculations but that would neither be elegant nor would it solve the problem that we could have a user select for example “Category” –> “Ship Mode” –> “Category” again as we cannot limit dynamically the parameter options.
dATA SOURCES
We will be using sample superstore data (therefore, connect to it) and simply add another source that will provide us with the list of options we want to provide.
So, open your excel or gsheet, name a column something like “dimensions” and write in it the list of dimensions we want to allow the user to select from.
Mark all, press ctrl + c to copy, go to Tableau, select a random sheet and press ctrl + v to paste

You will now have a second data source named clipboard_[date and time of pasting].
Stop here for now and follow along to building all the calculations we need. Pay close attention where (i.e. in which data source) you build them as we are now having two data sources, one being the clipboard source and the other one being sample superstore.
Calculations GALORE
Our approach is to store the selected dimensions in a parameter and then analyse in which order they were selected and based on that fill in some calculated fields.
Before going into calculatons, create two paramters:
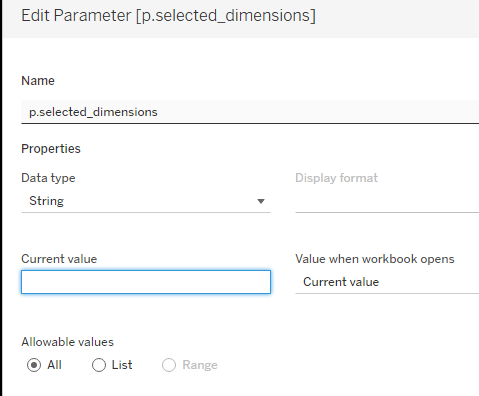
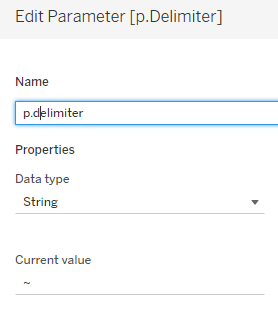
The reason for coding the delimiter into a parameter is that we will need it in both data sources and encoding it in a paramter makes it easier to use it
Make sure to create the following calculations in the “clipboard” data source!
//Delimited Selection
[p.Delimiter]+[Dimensions]+[p.Delimiter]
followed by
//TF is selected
REGEXP_MATCH([p.selected_dimensions], [Delimited Selection])
Now let’s check if three dimensions are already selected? (This can be modified to whatever number of possible selections at once you want to allow).
IF ISNULL(

    REGEXP_EXTRACT([p.selected_dimensions],
    '(?>(?>' + [p.Delimiter]
    + '([^' + [p.Delimiter] + ']+)'
    + [p.Delimiter] + ')'
    + '{' + STR(3) + '}' + ')')

) THEN FALSE ELSE TRUE END
This calculation uses a regexp calculation to see if we can find a third item in our parameter that (will) store our selections that have been made. If not, it will return null and we signify that as a false, else its true which means three items have been selected. This will be used in our next calculation. Shout-out again to Jonathan Drummey, this is his work.
//Write to param
if [TF is selected] THEN REPLACE([p.selected_dimensions],[Delimited Selection],"")
ELSE
IF NOT [TF all dims selected] THEN [p.selected_dimensions] + [Delimited Selection] END

END
So this calculation checks if the parameter already holds what was clicked and if so, removes it by replacing it with nothing (the two double quotes with nothing in between them). Else, if the clicked selection is not yet part of the parameter, we will add it but only if our afore created calculation returns FALSE (i.e. there are not yet 3 items in the parameter), in which case we add what was in the parameter plus the new delimited selection.
The last two calculations are used to sort and to show how many dimensions have already been selected.
//Position
IIF(FINDNTH([p.selected_dimensions],[Delimited Selection],1) = 0, null,FINDNTH([p.selected_dimensions],[Delimited Selection],1))
and
//Position Rank
rank(max([Position])*-1)
Here we check if our selectable dimensions are in the param, if not, return null. IF they are, return the position within the param. The position here is based on the first instance when the search term is found so it could return 1, 12 and 27 for example.
Therefore, the second calculation turns this into a usable rank (for a “1 out of 3 are selected” highlighter that we are going to create). Since position 27 is higher than 1 but in fact position 1 is our first rank, we have to multiply the position by -1 to get it in correct order.
Final calculation:
//how many selected
window_max([Position Rank])
Now, move over to sample – superstore data source,
Here, create three calculations that only differ on the last bit and its a copy of what we have in another calc already:
//Dim - Selection 1
    REGEXP_EXTRACT([p.selected_dimensions],
    '(?>(?>' + [p.Delimiter]
    + '([^' + [p.Delimiter] + ']+)'
    + [p.Delimiter] + ')'
    + '{' + STR(1) + '}' + ')')
Duplicate this two more times and replaces the 1 in the last row with 2 and 3 respectively.
Based on this, create three further calcs.
//Drilldown Dim 1
CASE [DIM - Selection 1]

    WHEN 'Category' then [Category]
    WHEN 'Sub-Category' THEN [Sub-Category]
    WHEN 'Ship Mode' THEN [Ship Mode]
    WHEN 'Segment' THEN [Segment]

END
Duplicate twice and replace the references to Selection 2 and 3.
Build the sheets
Sheet 1 will be out selection sheet, the second one will show the table and sheet three will be a header sheet.
Selection sheet –> Source: clipboard

Put the dimensions and calculated fields as shown. For “Position rank” right click, edit table calculation –> specific dimensions –> tick all of them.
Pick your shapes and colors for selected and deselected as you like.
Make sure you have “Write to param” calc available on the details.
Set “how many selected” to also address (that is: all ticked) all dimensions. Be aware this is a nested calculation so make sure all is ticked on both.
Edit your title:
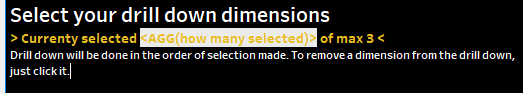
Done.
Table sheet
For the table sheet, simply put all “Drilldown Dim” fields next to each other and add a measure of your choice to the labels. (I used Sales).
Right click and hide field lables:
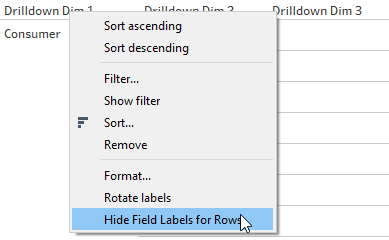
Done.
Header Sheet
As you will have noticed, we have just hidden our headers which I guess makes sense given that they would have been named Drilldown – Dim 1 etc.
So, build your last sheet, and add the DIM – Selection 1 to 3 onto the rows.
For those that are null, right click, edit alias and replace with a space.
Then, we need to get rid of the ABC.
To do so, select the right hand side border. Press CTRL and press right hand side arrow 3 times. Then, select the border, drag it with your mouse as small as you can. Again, keep ctrl pressed and press left arrow 5 times. It’s gone. See the following gif.

Create your dashboard
Bring all sheets onto your dashboard, adjust formatting as you like.
For the last step, create a parameter action and set it like this:

And with that, we are done. Your users can now decide on their own drilldown path for up to three dimensions.
Obviously, you can add as many as you want but I would suggest to keep no more than three dimensions as a possible selection as things become quite messy fast.
But in the end, up to you.
Find my workbook here
And that’s it for today. I hope you found that useful.
As always appreciate your feedback.
Until next time.
Steffen

Thank you for this amazing solution. It is well described and well designed.
I successfully built my own version, but then ran into strange behavior. I’m hoping you can offer some insight:
After initially working as expected, now, NULLs are appearing in the header sheet whenever a [DIM – Selection 1 to x] should be blank. The Drilldowns are still working correctly.
Have you seen this? I haven’t been able to figure out the issue.
Thanks very much for any ideas you can offer.
LikeLike
Hi,
No , I have not encountered that issue. If you want you can post on the Tableau community forums and point me here to the question. If you post your workbook, I shall be happy to have a look at it
LikeLike
Thanks very much.
I’ve created a forum post:
https://community.tableau.com/s/question/0D58b0000Bk9zZqCQI/tableau-cannot-evaluate-the-query-that-results-from-this-calculation
LikeLike
FYI, I’ve added a dummy workbook to my forum post that has the issue.
LikeLike