For today we want to see if there is a way to evaluate the level at which our view is set.
What do I mean by that?
Assume this is our hierarchy:
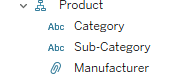
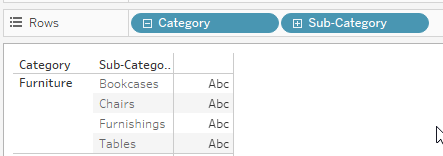
and the task is to know if we are drilled down to Category, Sub-Category or Manufacturer. For example, in this screenshot, we are drilled down to the Sub-Category level, our middle level so to speak.
Why would I even want to know that?
Admittedly, the amount of possible use cases may be limited but there are times when you might need to change a measure (or an aggregation) depending on the drill down level.
Assume you have staff in a range of factories and your hierarchy is factories and within each factory, there are divisions. Now, assume your staff can change from a division to another division but also from factory to factory. And you want to know the number of “logins” and “logouts”.
This means that at the division level, we would need to apply a different measure / calculation then on the factory level.
On the factory level, a logout should only appear on the factory where the employee leaves and the login in the other factory where he joins.
So, on factory level we would ignore any “intra-factory” (i.e. within the same factory) changes that happen on the division level which in turn is something we would need to look at if analysing the divisions within a factory.
So, I hope this gives some idea on a possible use case.
Solution 1
The first option is to use this calculation
// Solution 1
// go from min level to max level, this is important

IF sum(1) =  COUNTD([Manufacturer]) THEN 'min'
ELSEIF sum(1) = COUNTD([Sub-Category]) THEN 'mid'
ELSE 'max'
END
What we do here is that we make use of the fact that every drill down comes with a new number of rows. In our example, there are three categories with 17 sub-categories and 84 manufacturer rows, if fully drilled.
One word of caution: Notice that the manufacturers are not unique. There are 72 unique manufacturers but 84 rows in the hierarchy drill down.
Let’s understand how this works out.
Level 1, max at category:
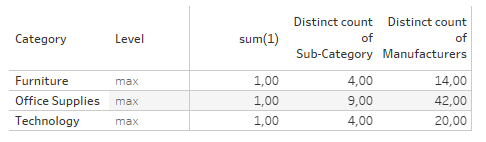
As we can see, the first two conditions are not met, thus we end up at the max level.
At the second drill-down we get this:
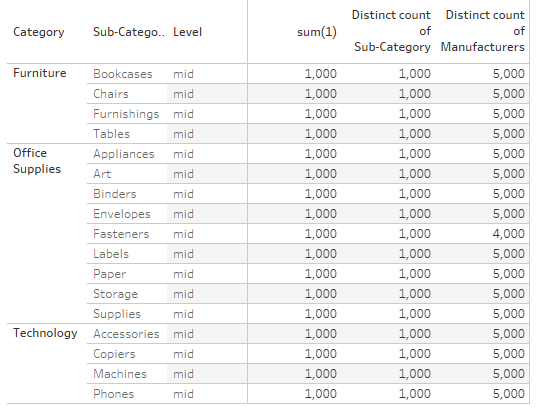
Now our sum(1) holds true for the sub-categories but still not for the manufacturers.
Therefore, our if condition in the level-calculation fails at the first step and results in true (and stops there) on the second part.
If we fully drill down we get

Here, the sum(1) is the same for sub-category and manufacturers but since manufacturers are evaluated first, the level calculation returns to us that we are at the minimum drill down level.
We can now make use of our level calculation and change our measures dynamically (or the aggregation, whatever you need):
//dynamic measure
CASE [Level]

WHEN 'max' then Sum([Profit])
WHEN 'mid' THEN SUM([Quantity])
ELSE sum([Sales])
END
But: there is a caveat:
Those of you that have been thinking ahead will immediately notice a potential shortfall:
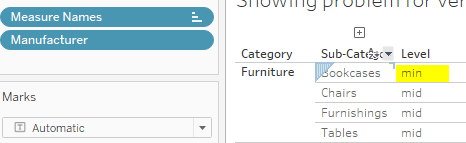
What if we filter out manufacturers Dania, Ikea, Safco and Sauder? In that case, Bookcases will see a 1:1 relation for sub-category to sum(1) as well as for manufacturers and sum(1). This leads to an error when we are at the middle drill down level:
In the next screen, I have filtered and then drilled to sub-category and we get a false value returned:
So, we would need a means to make our calculation less prone to this simple kind of error.
Let me tell you straight away, personally I did not find a means to 100% mitigate this problem but we can very much reduce it.
Solution 2
This solution is a bit more complex because instead of evaluating the sum(1) test on a per row level we will check the overall row count per drill down level vs what we have in the view.
First, create this calculation
window_sum(sum(1))This will return to use the number of rows in the view at the respective drill down level:
We need the window sum to get the number of total rows visible on the view.
Next, we need to create two calculations against which’s results we evaluate the afore window_sum calculation to define our drill down level. We will do so by artificially recreating the level of detail in the view and then ignore it. Sounds strange, doesn’t it?
//Max manufacturers
{exclude [Category], [Sub-Category], [Manufacturer]: sum({include [Category], [Sub-Category], [Manufacturer]: sum(1)}) }
The inner part (include…) pretends that we are always at the maximum drill down level, down to manufacturer and then returns to us the sum of 1’s for that drill down level. We know this should be 84 if unfiltered. Then, we exclude all the dimensions to always get the 84 returned, no matter what actual drill down and thus granularity we are at.
The second calculation is basically the same, just one level of granularity less:
//Max Sub-Categories
{exclude [Category], [Sub-Category]: sum({include [Category], [Sub-Category]: sum(1)}) }
As you can see, its the same just that we leave out the manufacturer dimension.
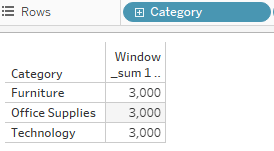
And we get:
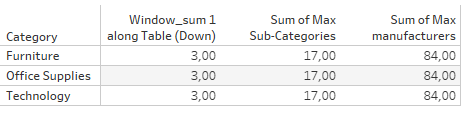
17 rows for the sub-categories and 84 for the manufacturers, even though we are not drilled to theses levels which is why our window_sum returns only 3 for the three categories.
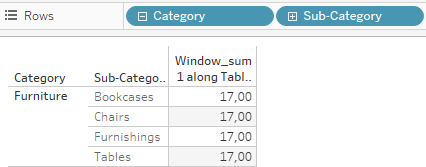
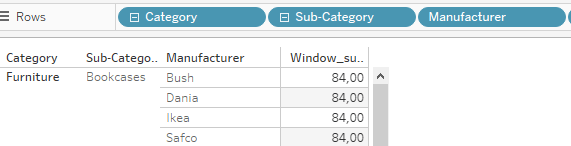
If we drill down:
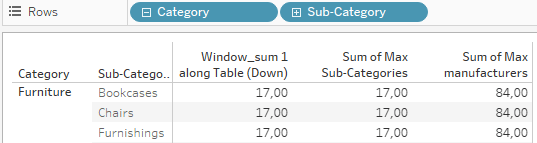
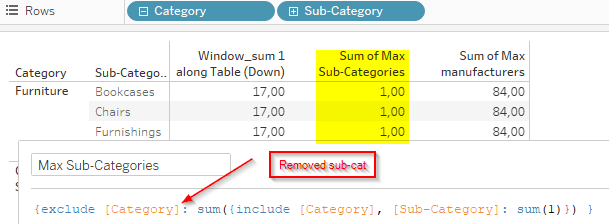
But what happens if we change our exclude and remove sub-category from the exclusion?
Well then Tableau will calculate at the granularity of the view, i.e. considering the sub-categories and we get:
So with this cleared, we can now do our level calculation:
// Level - Solution 2
IF [Window_sum 1] = sum([Max manufacturers]) THEN 'min'
ELSEIF [Window_sum 1] = sum([Max Sub-Categories]) THEN 'mid'
ELSE 'max'
END
Since we are using LODs, we need to aggregate them to make them comparable to our window_sum.
And with this can now with a relative high degree of freedom filter and play around with out dimensions because the only chance for a misleading identification in the drill down is when our number of the higher level rows equals exactly overall the number of the next more granular level. This may occur in certain circumstances but I believe in general it is safe to say that when using hierarchies there normally is a significant increase in rows level over level.
Find the workbook on my tableau public.
And that’s it for today. I hope you find this useful.
As always, appreciate your feedback.
Until next time.
Steffen

Leave a comment