By incident, today’s blog post is somewhat related to my last post and once again comes straight out of the Tableau forums where the solution I am going to share has been very well received. Apparently, this is a topic that concerns many users.
The question asked was how we could show each single item that was selected in a filter and a customized total in case everything was selected. So for example we would want to see “Art, Binders, Chairs” when these sub-categories had been selected and “All sub-categories selected” if all sub-categories had been selected.
Two obvious solutions – or not?
Let’s have a look at the seemingly obvious solutions.
Try 1: Use the sub-category on the title
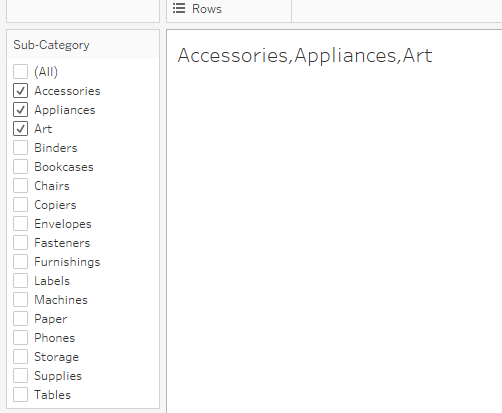
To do so, simply use the sub-category as filter, double click your title and insert the sub-category dimension in the title:

Now, when we select an item from our category filter it starts to look just fine:
However, if we select more than three:

Not exactly what we want. Also, if we select all we get:

Close, but not what we wanted, We wanted to show a customized “all segments selected” info.
So, on to the next option.
Try 2: Use the sub-category on the text marks
Maybe this is what we need?

We could even add a separator like a comma after each item from out selected list. But, what happens if we select all?
We get every single item shown but no “all” (not even dare to speak of a customized “all”)
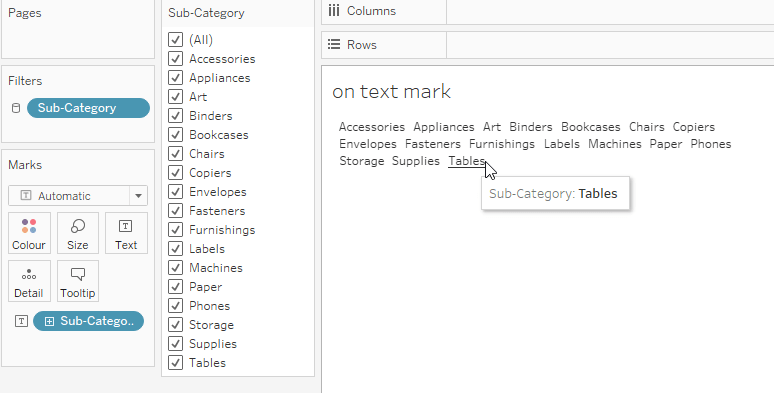
Notice that in the above screen I have put the mouse to hover over tables as an example. As you can see, each and every item is an individual mark that we can select.
This might seem irrelevant, but really it is not. Because this tells us that Tableau slices everything we do along the Sub-Category. As a reminder: everything on the Columns, Rows, the Pages and the Marks Shelf (here with the exception of tooltips) is considered “in the view” which defines our granularity.
Developing the solution
In order to know whether or not everything has been selected we clearly need to compare our count of selected sub-categories against a baseline.
This baseline can either be hardcoded (there are 17 sub-categories) or – more sensible – be made dynamic.
Let’s find our baseline by using an LOD (note that later on I will incorporate most steps into one formula)
//Baseline
{fixed : countd([Sub-Category])}
Now, what we need to do is to compare the number of selected sub-categories against this baseline. How about we just go by using
//Count of Sub-Categories
countd([Sub-Category])
Ok, let’s put both on a filtered but otherwise empty view:
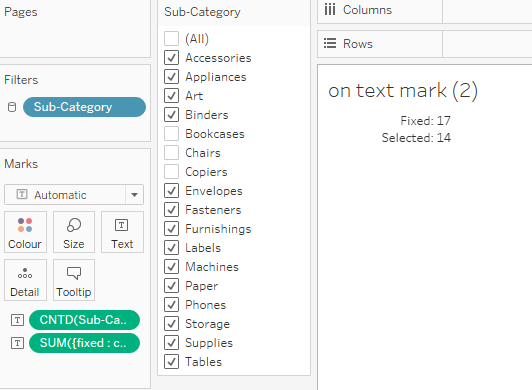
Looking promising, isn’t it? But we do not want to simply count but also show what has been selected.
One might be tempted to put these into a calculation like this:
if COUNTD([Sub-Category]) = SUM({fixed : countd([Sub-Category])}) THEN "All sub-categories" else ([Sub-Category]) ENDBut you will be greeted with a hint that this does not work since we are using aggregated and non-aggregated values. Hint: Sub-Category is not aggregated.
Ok, so what if we simply aggregate Sub-Category? For example by using a min() function?
Well, then we get this:

The aggregation gives us only the minimum, i.e. appliances in this case.
So, this is not what we want.
Can’t we just put the sub-categories on the text mark again? This seemed to almost work before, right?
In order to more clearly show the effect, let’s not put it on text mark but on rows
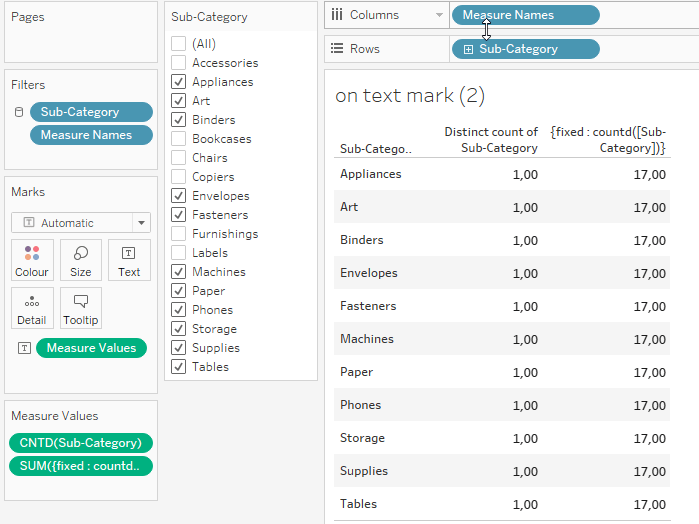
Oh no! now we can see that our condition would never yield true because Tableau slices the data
So, our relevant finding is that the granularity poses an issue here. That means we need to put everything into one data point / mark (remember I highlighted above that every sub-category was a mark of its own?) but in order to do so, we need the granularity in the view.
Let’s solve this one step at a time. In order to get a list of selected sub-categories, create this calculation (avid readers of the blog will surely recognize it).
//Calculation 1
PREVIOUS_VALUE(ATTR([Sub-Category]))
+
IF CONTAINS(PREVIOUS_VALUE(ATTR([Sub-Category])), ATTR([Sub-Category]))
THEN ""
ELSE ", "+ATTR([Sub-Category]) END
This will give us a concatenated list of all the selected sub-categories. but only on the last mark we will see everything. again, let us have a look using sub-categories on rows:

Next, create this second calculation:
//Calculation 2
window_max( [Calculation 1] )
With this we make sure we always get the full list, i.e. in the above screen the version that is included in “Binders”.
Now, the magic sauce
//Caclulation 3
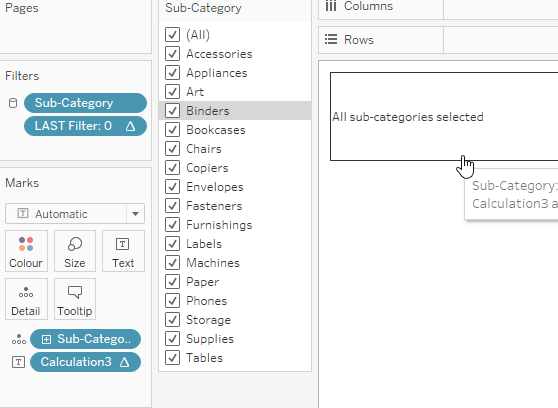
if max({exclude [Sub-Category]: countd([Sub-Category])})=max({fixed : countd([Sub-Category])}) then "All sub-categories selected"
else [Calculation2] endWhat we do here is we compare the distinct count of Sub-Category with the fixed maximum count of distinct categories (the latter tells us how many sub-categories there are) but, in order not to always receive a 1 for hte first part (as we did see in the screen two above) we exclude the sub-category from our slicing.
And if the condition does not hold true, we will get the concatenated list of items that we selected from calculations 1 and 2. Set the “compute using” to “Sub-Category”
Finally, this filter calculation:
//Calculation 4
Last()
Put this on the filter shelf and select “compute using sub-category”. Then set the condition to 0.
And with that, we are done.

And that’s it for today. I hope you found that useful.
Find the workbook on Tableau Public.
As always I appreciate your feedback.
Until next time.
Steffen

Leave a comment