It’s Christmas, the kids are super tired from the exciting day and I am the only one left awake. What could be a better way to (most likely) conclude the year than to provide another example on table calculations?
Today I have nothing new or unexpected, it is just adding to the vast array of explanations of the matter with yet another example which is based on a question on the forums where the user asked how he could look up values. The user wanted to be able see previous prices of several products. His perceived challenge was: items could be added or removed or re-added after a period of abstinence.
Therefore, products within a year might look like A/B/C/D/E, then the next year A/C/D/E/F etc. So, not really any consistency. But does that pose a problem?
Let’s quickly set the scene
This is what my screen looked like:

So, we got the year, the products and the price per product within the respective year and the column which will show the looked up value.
The user had come up with some kind of complex calculation which still didn’t allow him to achieve what he wanted.
Getting it done
In fact, all we need is a single, expectable function and to set its partitioning right
//lookup_tc
lookup( SUM([Price]),-1)
Partition it by product and address the year like this:
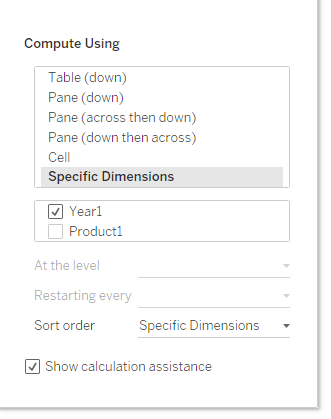
This translates to “for every product by year give me the previous value (the lookup -1)” or, as I prefer to put it into speech: “within every product across the years give me…”
And with that, we are done.
In this screen you can see that product B is removed in 2025 but comes back in 2026, still the approach finds the value from 2024 and correctly attributes that as the previous price

So how does this work?
What we did here is we told Tableau to
- calculate in deviation from what is in the view, so our calculation does no longer follow the dimensional structure that we have on our screen
- We specify how Tableau shall calculate
- We define the partition (unchecked parts, in our case the products) which represents sub-tables that are created for the calculation
- we define the direction in which the calculation shall move, here along our years
So what we do with this is, we create – in this specific case – sub tables per product. Sticking with our product B such a table would look like this:

Since we address the year, that means the calculation will run along the years, within our product B table (and within every other product’s sub table)
That is why it does not matter whether a product gets added, removed or re-added. See above, we are missing the year 2025 but for our logic, that is irrelevant. All we want is to lookup the previous value (the row one above current row) which is no problem within our sub table.
I hope you found this “live” example useful. As said, nothing new or out of the ordinary but I have come to notice that in many cases apart from worded explanations a concrete example is missing. So I thought I’d add to that.
Have a great day and as always appreciate your feedback.
Until next time
Steffen
