Following up on my >> previous blog post << I had the pleasure to virtually meet with Kirk Munroe and discuss the issues outlined in my posting.
For those of you not yet familiar with Kirk, he is the author of “Data Modelling with Tableau.” He is also a frequent guest on renowned Tableau blogs and Youtube channels. These include the Flerlage Twins blog where he expedites his expertise on >> how Tableau’s Data Model works << and Tim ‘Tableau Tim’ Ngwena’s Youtube channel which as of recently features a >> Masterclass in Tableau Data Modelling << .
Guess everyone will understand my excitement to welcome such a knowledgeable Partner for this blog post. The first ever shared / guest blog post here on my small blog.
The first part will consist of a recap of our call with lots of examples of what we had a look at.
The second part written by Kirk will then focus on the technical explanations. We will identify where the descriptions and marketing promises are off or imprecise. We will also suggest ways to achieve what the feature of table scoped data source filters in relationships is supposed to do.
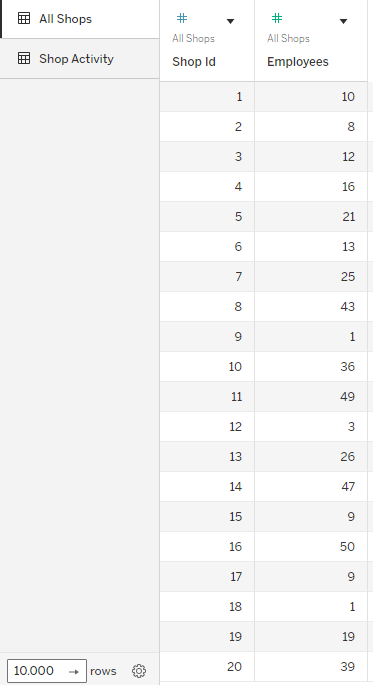
As a quick reminder, this is what our sources look like:

Intro: All kinds of filters in relationships
Recap part 1: Relationship without any filters
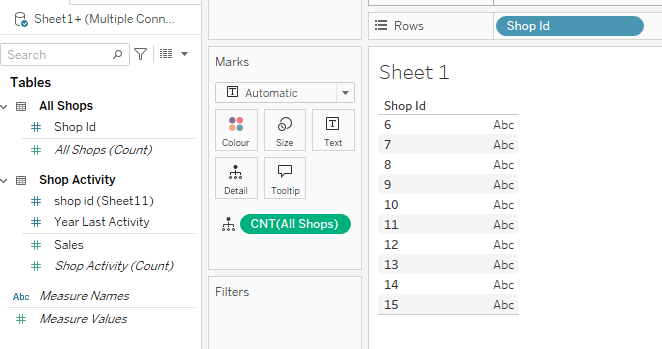
The following gif illustrates once again the behavior of relationships when no filter is applied. First, we add just some shop ids from a fake data source. Then, we add the shop ids from the second, related source that misses some of those ids. Following we shall add a measure value in two ways.
Notice how adding the [shop id] field from the related source limits the returned dimension members to those matched – which makes sense.
Also notice how adding just the sales value from the related [shop activity] table shows values for the 15 matched ids, but it does not limit our returned rows to those values present in the root [All shops] table.
Only when adding the [shop id] field from our related table do we experience the limitation to the ids that are matched. For your reference take good note that it is not necessary to add the related dimension. As the next GIF shows, we can also add another dimension from the related table and it will limit the returned rows to those ids shared in both tables.

We can get back all [shop ids] from the [All shops] table by adding the [count] field into the view. Here, we do so by adding it to the detail marks card.
Alternatively, we can just click “Analysis” –> “Table Layout” –> “Show empty rows / columns”.

Recap part 2: Relationship with data source filters applied to the whole relation
Now let’s add a data source filter to our related table where we shall filter the years 2022 and 2023 out

With this filter set, we have no way to return more than the shop ids 6 to 15 which are present in both our sources.
Notice how on the next screen we use the [Shop ID] field from the All Shops source and we even tried adding the [count] field but to no avail:
The reason for this behaviour can be found in the way Tableau operates and at what time it processes which step of filtering and joining. Kirk lays this out in detail further down below.
Recapt Part 3: Applying a Dimension Filter in the view, not on the data source
For the next part I have augmented my [All shops] to also include a measure, namely [employee count].
We start with our build like this:

So far, so good. Now let’s say we want to finally achieve a view that will give us the employee count per shop and the sales but only sales after the year 2022. As we know, not all shops have made sales after 2023 but my end goal is to still show these shops with their employees.
On the next gif notice how we:
- First add the filter and it has no “null” in it.
- Once I untick 2022 and 2023 the view gets fitlered to only IDs 6-15 as these have the matching shop ids for the filtered years.
- I can then add the [count] field from my [All shops] table. Notice how now we have “null” in the filter which we need to tick.
- We now get the IDs 16-20 back in the view.
- Still, we are missing IDs 1 to 5
- For that, we need to use table layout and show empty columns again.
- If this is ticked, we can also remove the [count] field.
- The filter will continue to show “null” but ticking or unticking this null will not do anything as Tableau is only artificially showing the missing columns. You can see that also from the fact that the “5 nulls” indicator is gone.

With the [count] field from our [All Shops] table in the view we can filter for those IDs that are not present in the [Shop Activity] table but (by clicking the null) but we cannot get those that are not shared.
Now let’s see what happens if we add our measure [Employees] from the [All Shops] table.

So, the problem here is when we filter out a year, we also lose the measure value from our root table, the [All Shops] table.
But what if we want to filter only the activity table? Our example is fake but there can be cases where you just want to add a limited amount of data from one table but still keep the entirety of the second table.
This is what the new scoped option should be for, so let’s test this again.
Recap Part 4: Scoped Data Source filters
This is looking quite like what we wanted to achieve. Our root table [All Shops] is unfiltered showing the number of employees for every shop whilst the sales data from the activities table is limited to only 2024 and 2025.

So, all fun and games?
Sadly, not entirely. Notice on the following gif how adding another dimension from either of the two tables basically destroys what we need. Also take good note that when I am adding the Shop IDs from my [All Shops] table to the filter, there is only IDs 6 – 15 available in that filter, i.e. those IDs that are shared between the two tables. Just like a dimension filter that is set to “only relevant” after filtering the years to 2024 and 2025.
In contrast, the years filter will, when set to show the same years as they are already defined in the scoped filter, just filter the values for [employees] field but maintain the [shop id] dimension members.

Before now handing over to Kirk who will be giving his insights and explanations into the why and how and some guidelines of “what to do if you want to achieve X” vs “what to do if you want to achieve Y” let’s have one last look into using custom sql on activities table.
As the release notes said, custom sql (i.e. filtering the activities to the years 2024 and 2025 directly in sql) should be replaced by the scoped data source filters.
Let’s check if this is truly the case.
In the final example I am using a custom sql to limit the activity years to 2024 and 2025. Its a slightly different data source so don’t be confused.
With just the [shop id] field from my [All shops] source we get 79 rows. When adding then the shop id field from the related source, we get initially 33 rows that we can isntantly expand back to 79 rows if we either add a measure from our root source, or we tick the “show empty rows / columns”.
Also, notice that contrasting the scoped filtered version, when having dimensions from both related tables in the view and then adding the [Shop ID] field to the filters, it will still show 79, not a limited amount (compare that to the ID 6 – 15 in our scoped filtered gif above). Also, the year of last activity automatically includes null.

To conclude: it seems custom sql still has its right of existence as we can get different behaviour from it when using pre-filtered custom sql that we cannot (!) mirror / rebuild when using table scoped data source filters within the relationship.
And with that it is now Kirk’s time to grant us insights into his deep understanding of the matter and the technical backgrounds.
Query Logic from Part 1 – No Filters on Logical Model (i.e. Relationships)
Tableau has some really strong heuristics here but they are not well-documented. The heuristics are:
- if you only bring in dimensions from related tables, Tableau will do an inner join
- if you bring in a measure from one table, Tableau will do an left(or right, depending on your setup) join with that table
- If you bring in measures from both tables, Tableau will turn the query into a full outer join.
How does this work with the steps Steffen did?
1. Pulling Shop ID on from the All Shops table returned all 20 shops in that table – no join.
2. Pulling in Shop ID from the Shop Activity table told Tableau to inner join on those two fields. In other words, display only the Shop IDs that are in both tables. For this reason, shops 16-20 disappear from the view because they are not in the Shop Activity table.
3. Pulling in Sales (a measure) from Shop Activity does not “look” like anything changed in terms of the query (other than bringing in the measure), but it actually did. It told Tableau to do a left join to the Shop Activity table. However, and as mentioned above, that table only has shop IDs 1-15, so nothing changes in the view.
4. Finally, pulling in the All Shops count (the Tableau generated row-count measure) from the All Shops table causes Tableau to do a full outer join for our related tables, which is why shops 16-20 reappear! If Steffen had wrapped his (Sum of) Sales measure with the ZN (zero null function), Tableau would have returned zero sales. Perfect way to ask the question, “What are the sales per shop, include all shops including the ones without sales?”
Personally, I don’t like the “Analysis” –> “Table Layout” –> “Show empty rows / columns” options as it forces all outer joins and I lose control. Knowing the heuristics I mentioned at the top of this section, I would rather control the joins myself vs this approach.
Query Logic from Part 2: Relationship with data source filters applied to the whole relation
Tableau does not do a great job of documenting how the order of operations of filters impacts the heuristics of the queries I described in Part 1.
Taking the example of data source filter with “related tables” (the only option before 2025.1), what Tableau is doing – by the inner join – is eliminating all Shop IDs from all related tables except for 6-15. Think about it this way:
Tableau looks at this filter:

And then, the order of operations is:
- Tableau filters the list of Shop IDs from the Shop Activity table if they have Year of 2024 or 2025 (i.e. 6-15)
- Tableau looks at every table that is related on Shop ID, and filters to INCLUDE only Shop IDs 6-15
- Then, Tableau runs the heuristics described in Part 1. In other words, the outer joins still run BUT you don’t get 1-5 and 16-20 because they were removed from the data BEFORE the outer join ran.
What is interesting is that by excluding 2022 and 2023, instead of including 2024 and 2025, you might expect the same behaviour, but you won’t get it.
That is, looking at this dialog:

The order of operations is:
- Tableau filters the list of Shop IDs from the Shop Activity table if they have Year of 2024 or 2025 (i.e. 6-15)
- Tableau looks at every table that is related on Shop ID, and filters to EXCLUDE only Shop IDs 6-15
- Then, Tableau runs the heuristics described in Part 1. In other words, the outer joins still run BUT you don’t get 1-5 BUT you get 16-20. This is a bit confusing – but the reason why is that Tableau first eliminated 1-5, but it didn’t say anything about 16-20 because they don’t exist in the table we filtered.
Query Logic Part 3: Applying a Dimension Filter in the view, not on the data source
I think – after the explanations for Parts 1 and 2, that this will now make sense. Let’s jump ahead to Part 4…
Query Logic Part 4: Scoped Data Source filters (Logical Table Filters)
As of writing, as Steffen points out, logical table filters are not the same as filtering a single table using custom SQL with a WHERE clause. Logical table filters are – effectively – dynamic dimension filters applied to a table in the data source. In other words, the logical table filter is applied AFTER the heuristics I describe in Part 1.
Let’s look at this logical table filter:

You notice that it is on the Shop Activity table. What happens if we drag in Shop ID from the All Shops table, along with the Employees measure:

We get all the shops – the filter does not affect our All Shops table in any way at this point. The reason is that the logical table filter is not associated with this table.
What is we replace the Shop ID with the one from Shop Activity:

Or, what if we bring in the Sales measure from Shop Activity and the Shop ID from All Shops:

In both cases, with the logical table filter with items selected (included not excluded), the behaviour you get with Tableau when anything from that table is brought into the view is the same as if a dimension filter was put on the filter shelf with the values from your logical table filter. (Tableau, please add this visual indicator!)
Let’s go back to the query logic we learned about in Part 2. In other words, let’s exclude years 2022 and 2023 instead of including years 2024 and 2025:

If we go back to our viz, we see a slightly different behaviour. We can now see Shops 16-20 if we bring them on from our All Shops table:

The reason is that Tableau will join these tables together in the view and THEN apply the filter to eliminate any shops (from either table because of this order of operations) from the view. Shops 16-20 appear from the All Shops table because they don’t have years 2022 or 2023 in the Shop Activity table.
If you want to test it out by adding a dimension filter to the view that corresponds to the logical table filter, you will see the same behaviour.
In conclusion, at the time of this writing (2025.1.1), I would recommend against using logical table filters for now. They are hard to understand and with the lack of visual cues, they can be misleading. Let’s stay tuned and see where the feature goes in the future!
And with that, we are done.
The first “co-hosted” post on tableauadventurer ever.
We hope you enjoyed reading as much as we enjoyed wrapping our heads around the filter logic.
As always appreciate your feedback.
Until next time.
Kirk & Steffen

Leave a comment