Over my Christmas Holiday’s I finally had a little bit of time to go back to practicing a bit / playing around with Workout Wednesday challenges and since I had’t done so in a long time, there were plenty for me.
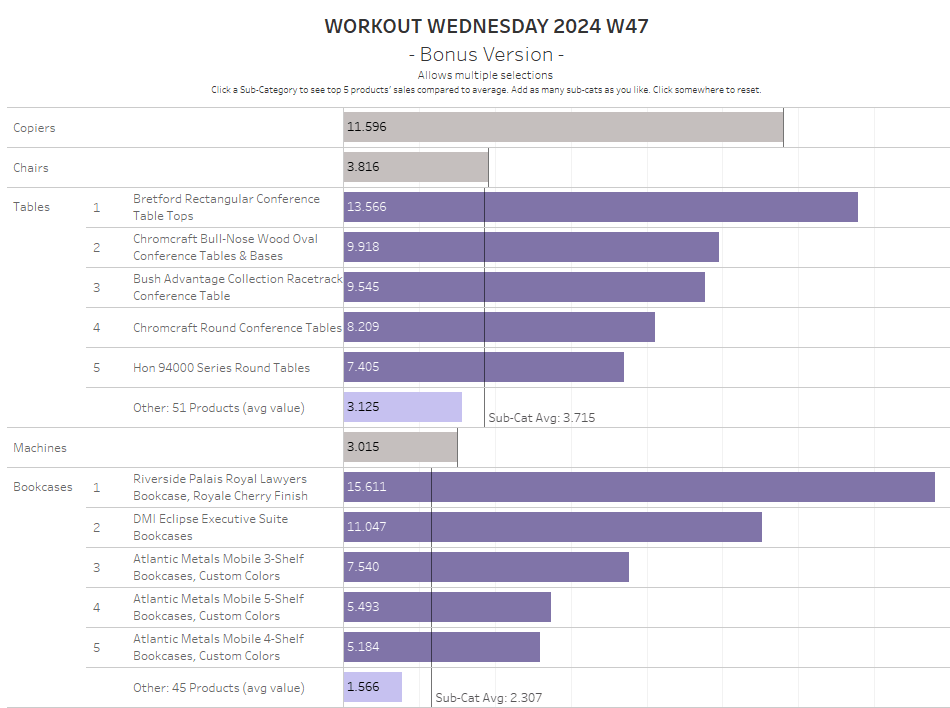
Week 47 by Erica Hughes asked us to provide a solution to a three level challenge. Requiring the option to drill into sub-categories using sets and then show top 5 products with their respective sales compared to the sub-categories’ average for the remaining products.
A bonus challenge which was only mentioned in the text but not built out by Erica was to enable the user to select multiple sub-categories instead of only one.
And this is what we will built:
The solution to this challenge is trickier than allowing only a single item to be selected since we cannot for example built a product names set based on the sub-category set.
The latter is a great solution. It basically builds the product names set based on whether the sub-category has been selected and then selects the top 5 by sales. If you want to read on that, find the solution on > Donna Coles’ blog < .
Unfortunately, it is not feasible for multi-select as the required top 5 selection for the products will now comprise a a diverse range of products from multiple sub-categories instead of the top 5 per selected sub-category.
How to allow multi-select with Top 5 and other.
Part 1: calculations
Let’s start by connecting to sample superstore. Thereafter, follow these steps:
Step 1: Create the sub-category set
Right click sub-category, go to “create” and then “Set”.
Step 2: create an index() function
//index
index()
Note that I generally like to make things such as index available in separate calculations. It may not be needed every time I do that but often it is and I just do it for consistency (or at least I try…).
Step 3: Count the number of products per sub-category
//count products per sub cat
{fixed [Sub-Category]: COUNTD([Product Name])}
Step 4: Top 5 Products and Others String field
//Top 5 Products and Other String
IF [index] <6 AND max({fixed [Sub-Category]: max([Sub-Category] in [Selected Sub-Cat Set])}) THEN max([Product Name])
ELSEIF [index] =6 AND max({fixed [Sub-Category]: max([Sub-Category] in [Selected Sub-Cat Set])}) THEN max('Other: '   + STR( [count products per sub cat] -5)   + ' Products (avg value)' )
ELSE ''
END
This will likely need some explanation.
The first part of the “IF” clause basically states that if our index (consider this the row numbering of our table) is smaller than 6 (which means it is in the Top 5 if ordered descending), AND per sub category (the fixed clause) we can confirm that this specific sub-category is in the sub-category set THEN return the product name.
The ELSEIF condition checks if we are at row 6 in which case we want to use this row to show our “Other” results, i.e. the number of none Top 5 items in the sub category.
Finally, if neither holds true, then we just leave it blank.
Since we are using index functions which are table calculations meaning they are late in the order of operations, we need to work with aggregates, thus the multiple “max”es in my calculation.
Step 5: Ranking string
//Ranking
if max([Selected Sub-Cat Set]) and [index]<6 then str(index() ) else '' end
This will give us a rank from 1 to 5 and a blank beyond that.
Step 6: Count of non-top 5
//count of non-top 5
[count products per sub cat] - 5
Step 7: Coloring
//Coloring
IF CONTAINS([Top 5 Products and Other String], 'Other: ') THEN 'Other'
ELSEIF [Top 5 Products and Other String] != '' THEN 'Top 5'
ELSE 'Unselected'
END
Here we make us of our more complex calculation from Step 4 and simply check if the string contains “Other: “. If so, we know that this is the bar that will show the averaged value for our non-top 5 values for selected sub-categories.
If “Other: ” is not found, then we check if the string is not empty. If it is not empty, we know it is in our Top 5 and label as as such (for easier coloring later on).
In all other cases, we want to apply a grey shade, this is our final “ELSE”.
Step 8: Dynamic sum of sales for selected top 5 or average for unselected and other
//Sales sum or avg
IF [Top 5 Products and Other String] != '' THEN

    IF  [index] < 6 THEN
        sum([Sales])
    ELSE
        window_sum(sum([Sales]),0,last()) / avg([Count of non-top 5])
    END

ELSE window_sum(sum([Sales]),0,last()) / avg([count products per sub cat])
END
Here we check if our string is not empty. If it is not, then we check if the index is smaller than 6, i.e. we are in our top 5 rows. In that case, return the sum of sales.
If we are beyond the index of 5, then we want to have the window sum reaching from the current row (say row 6) to the last row within our partition. Thus, 0 , last() in our window definition. We then divide this by the number of products that are not in our top 5 to derive the average.
If our string is empty, we fall back to the last ELSE clause where we sum the entirety of our partition from the current row to the last row and divide that by the number of products in the sub category. (Yes, there are alternative ways to calculate this).
Step 9: Build a filter
//filter
IF [Top 5 Products and Other String] != '' THEN TRUE
ELSEIF [Top 5 Products and Other String] = '' AND [index] = 1 THEN TRUE
ELSE FALSE
END
Here we want to keep all rows that are either having a string filled in (i.e. they belong to a selected sub-category and are rows 1 to 6, our top 5 products and the “other” which we placed in row 6).
Otherwise, if the string is empty, we need to make sure to not hide all our unselected sub-categories, which is why we keep the first row for each unselected sub-category.
All other rows we will hide by deselecting “FALSE” from our filter later on.
Step 10: reference line and label
//avg line per sub cat
{FIXED [Sub-Category]: avg({include [Product Name]:SUM([Sales])}) }
//avg line per sub cate - label
if [index] = 6 THEN SUM([avg line per sub cat]) ENDI created two calculations because not only do I want to show the reference line but also I want to label it – but only once, not on every row.
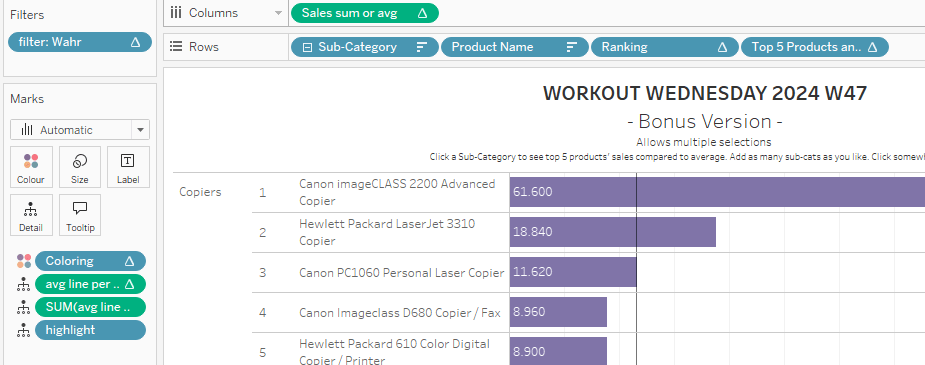
Part 2: Build the viz
For building this viz, we will need to play around with sorting and setting our table calculations right.
Build it out like this:
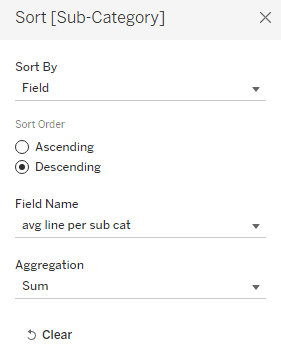
Set our sorting
Right click Sub-Category and select “sort”. We want to sort it by the average per sub-category, i.e. the sub-category with the highest average sales should be on top:
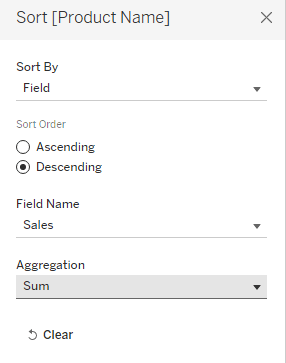
For Product Name, sort it by sum of sales descending. This way, we order the products with the highest sales on top within each sub-category:
Then right click product name and untick “show header” to make them disappear from the view.
Set the table calculations
One after the other, right click [Sales sum or avg],[Ranking] and [Top 5 Products and Other String] go to “compute using” and tick “product name”. Do the same for our filter field. Then click it and set “TRUE” to be our filter value.
Part 3: Final polishing
Add our coloring field to the color and set colors as you like.
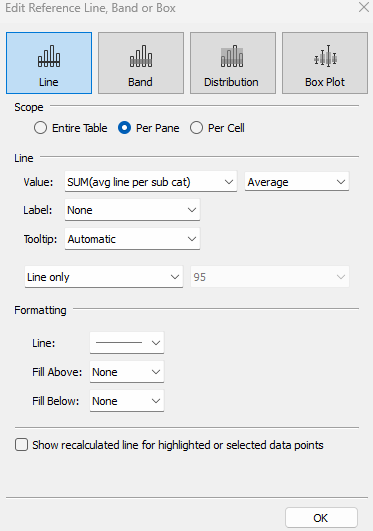
Add the two reference fields to the details, right click our axis, add two reference lines.
For the label reference line, set label to “custom” and adjust like this:

For our line, only keep the line and nothing else:
Finally, create a calculated field named “highlight” and just add ‘highlight’ in it. Add it to the details.
Create a dashboard, put your sheet there.
On the top, click the highlight marker and select our just created [highlight] field.
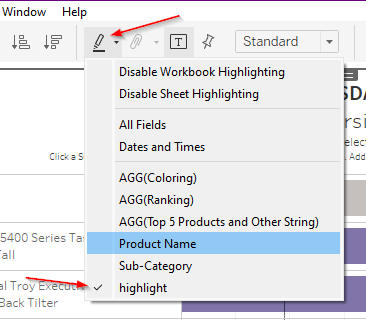
This will prevent sub categories from going grayish / faint when we select an additional sub category.
Lastly, add the set action.
On your dashboard, go to “Dashboard” –> “Actions” and add a set action as follows:

And with that we are done. You can now select as many sub categories as you like and all will show their respective top 5 products and the average of the remaining ones.
You can download the workbook from > my tableau public <.
And that’s it for today.
I hope you found that useful.
As always appreciate your feedback.
Until next time.
Steffen

Leave a comment