For this month’s posting we will have a look at how to enable your users to “filter” columns from a text table without actually filtering it.
Why would that be needed? Well one idea could be that you have one of these massive tables (you know, the ones you do not want to built but need to create anyways) and the user’s request is to maintain totals whilst being able to narrow down the table to see what they want to see easier.
Let’s build a fake massive table
Put months of order date (date value, discrete) on your colums and customer names on rows. Add double click [Sales] to showe the sum of sales within each month. Add column totals from the Analytics Pane (on the left, next to Data).
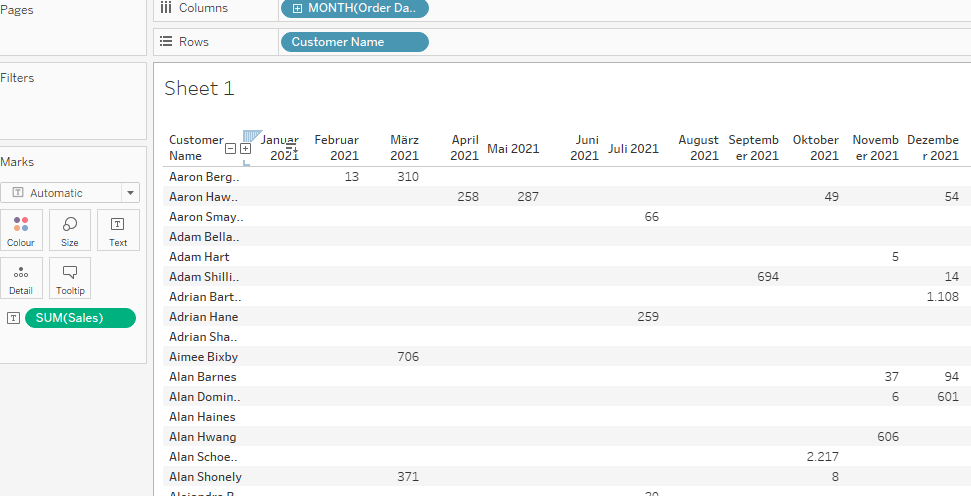
Your table will be a massive 800 rows times 49 columns table, hard to comprehend and see through.
How to filter w/o affecting the totals?
We want to be able to filter to specific months but keep the grand totals intact.
One way we could do this is to use an adjusted version of modified totals as is described here but that will quickly turn a bit more work intense the moment the number of requested measures increases.
And also in any case, adding another option to your tool belt will never hurt.
So, what other options do we have?
Dimension filters? Those will filter out months and thus affect our totals.
Sets as filters? Same as before.
Looking not too good here I guess.
But what if we…
Combine sets and the hide function
To achieve what we need, first right click [order date] on the data pane, create custom date

Select months and keep date value selected.
Next, with your new field available, right click that field and select “create -> set”

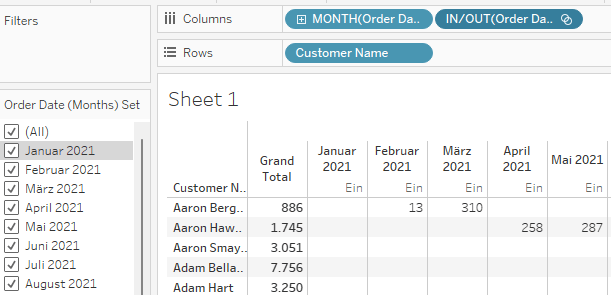
Put your set next to your months on the columns. Right click it and tick “Show Set”. Do not confuse this with the further down “Show Members in Set” as the latter will put the set onto the filter shelf which is not what we need.

Your view should now look like this. Notice the empty filters shelf and the “Ein” (“In”) on the screen below my dates. Also, for easier reference I have moved my totals to the left here but that is just for the screen.
Deselect one of the months.
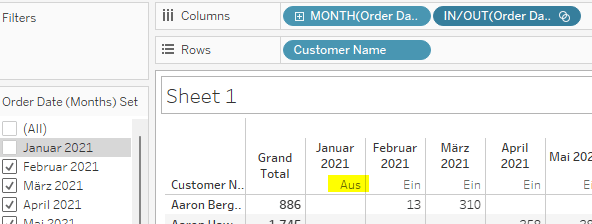
January 2021 now shows “Aus” (“Out”) of set.
Right click the “Out” and click “Hide”
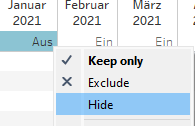
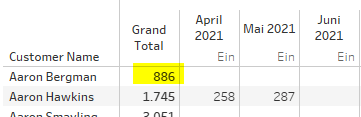
January 2021 will be gone from your view. Deselect now also February and March 2021 and notice how Aaron Bergman’s total will stay at 886 despite us having removed 13 and 310 from the view:
For a final touch, right click the set In/Out or the pill on the column shelf and untick “Show header”.
Downside
The downside to this approach is that your table will not collapse to those fields that actually have values in them. I.e. if you use a normal dimension filter and filter to say February 2021, you will see only 27 rows of those customers that we generated sales with.
With the hiding technique, all customers will stay in place.
Now this may or may not be wanted.
If it is not wanted, we can work around this as well.
Overcoming the downside
Create this calculation
{fixed [Customer Name]: max([Order Date (Months)] in [Order Date (Months) Set])}We have to use a fixed for two reasons:
First, when we do not use an LoD calculation, we will receive true/false for almost all customers because remember: we did not filter out anything, we just hid some months. That means, that anything like this:
[Order Date (Months)] in [Order Date (Months) Set]would be evaluated for all months in the set and therefore, unless a customer has sales in every month or never would always return true and false the moment we have a mixture of months in the set in which he either made a sale, or didnt. This then will split our view , disentangling also our totals like here:

However, if we turn it into a fixed LOD, we are now in a position to have the maximum evaluation of the afore calculation be returned.
The maximum of true/false is true. Therefore, as soon as there is one month in the set for the customer in which he made sales, the LOD will return true regardless if there are other months in the set that would on their own return false.
We have to use a fixed LOD because only fixed LODs can return dimensions.
The result when trying something like this where we use include just to be able to use an aggregation:
{include: max([Order Date (Months)] in [Order Date (Months) Set]) }that we will get in return is
because an include (and exclude) LOD will return a measure, not a dimension.
So, finalise our product by putting the fixed LOD version on your rows next to customer name and hide “false”. Untick “show header” and we are good.
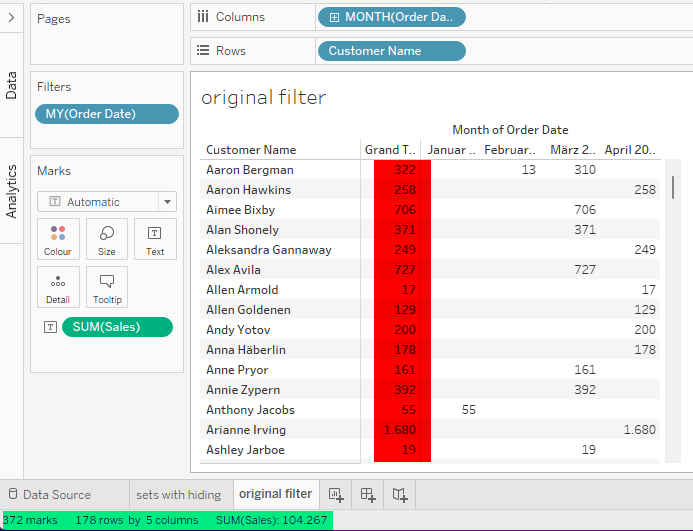
When we fake filter January 2021 to April 2021 we get this:

Comparing this to actual filtering you will notice that the number of marks, rows, columns and the sum of sales stated in the bottom are exactly the same. Just that the grand totals are now affected by the filters.
And with that we are done.
If you want to follow allong feel free to download my workbook.
I hope you found that useful and as always appreciate your feedback.
Until next time.
Steffen

Leave a comment