My original intention was to publish this blog no earlier than July but oh well, demand has been unexpectedly high for this one. So, here it is.
We are going to build a carousel in Tableau and it does luckily not require much from us.

One parameter and five + TWO calculations
Experienced bloggers told me to allow readers to skip the boring “why” parts and just get into the doing. So, if you just want to create, you can continue reading, create and then stop reading once your chart works. If you are interested in some more explanations, stick with me tell the end.
To get things going, create:
A text parameter that accepts all values. I named it p.take_item
Three ranking calculations:
//rank of selected item by sum of sales
RANK(sum([Sales]))
//original rank of selected item
window_max(if [p.take_item] = attr([Sub-Category]) then [rank of selected item by sum of sales] end)//dynamic positioning
IF [p.take_item] ="" THEN[rank of selected item by sum of sales]
ELSEIF [original rank of selected item] = [rank of selected item by sum of sales]
THEN 1
ELSEIF [rank of selected item by sum of sales] > [original rank of selected item]
THEN[rank of selected item by sum of sales]-([original rank of selected item]-1)
ELSEIF [rank of selected item by sum of sales] < [original rank of selected item]
THEN max({countd([Sub-Category])}) + [rank of selected item by sum of sales] - ([original rank of selected item]-1)
ENDTwo coordinate calculations:
//x - normalised dynamic
5 *
    COS(
        RADIANS(
            ([dynamic positioning] - 1) * 360/(max({COUNTD([Sub-Category])})) + 90
        )
    )
//y - normalised dynamic
3 *
sin(
RADIANS(
([dynamic positioning] - 1) * 360/(max({COUNTD([Sub-Category])}) ) + 90
)
)These are the five basic calculations we need for the carousel. The remaining two are just for optics and filtering:
//dehighlight
'dehighlight'
//TF is selected drill
[Sub-Category] = [p.take_item]Create the Carousel
Put [Sub-Category] on details or shape. I have it on shape because I assigned some random icons to the shapes.
[dehighlight] goes also on details.
[ x – normalised dynamic ] goes on columns.
[ y – normalised dynamic ] goes on rows.
Also, put [ y – normalised dynamic ] on color and on size.
Set the table calculations, i.e. X and Y calculations to Compute using -> Sub-Category.
Your screen should look like this:

Adjust coloring and sizing so that they start at a negative value and get into positive. Adjust as you see fit but make sure that the negative values are smaller in size and less saturated color-wise.
Right click both axis on your screen, fix them at -5.5 to 5.5 (both!) and also reverse both:

By using the same axis range, we make sure that our carousel get’s the more elipse style form and is not a perfect circle.
Create whatever you like for inside the carousel
For showcasing purposes, I just created the annual sum of sales per sub-category as a bar chart. Also notice I put the [dehighlight] details as well as Sub-Category on details. The latter serves for our title.
Put the [ TF is selected drill ] filter we created on the filter shelf and set to true.

Create the dashboard
Put the carousel on a dashboard and float your inner chart above it.
Hide all axis, carousel header, grid lines etc as you please and like.
Create a parameter action:

Create a highlight action by simply clicking on the small pen icon:

And that’s it. You should be done.
Unless of course you are interested in some words regarding the why and thought process behind. In that case, keep reading.
Thought process and explanations
A carousel is nothing else than an elipse that showcases selectable items around another chart or window that itself showcases results of the item selected from the carousel.
Also, a carousel can spin left and right and you can theoretically click anywhere on the carousel to make it spin.
With that said, here is the thought process.
- Every item on our list of items has to have a specific position
- This position needs to adapt based on what other item (or the item itself) is selected
- The positional change must enable more than a shift of just one position
- It must go in both directions so that we can spin back and forth as we like it.
Disecting the calculations
X and Y calculations:
The 3x and 5x respectivley at the beginning of the calculation only serve to make our circle an elipse. You might create the same effect by just compressing the sheet when you put it on the dashboard. This therefore is not a must.
The calculation defines the positions of all our items within our circle / elipse (again showcasing X but same is for Y using sin instead of cos):
5 *
    COS(
        RADIANS(
            ([dynamic positioning] - 1) * 360/(max({COUNTD([Sub-Category])})) + 90
        )
    )
The items that are not the selected items move their positions based on their dynamic positioning which we will discuss in a second.
However, note the -1 . This is because one item already has a defined position – the selected item. We then multiply it by 360 which represents our full circle but divide the 360 degrees by the number of items in our sub-category and then add back 90 degrees.
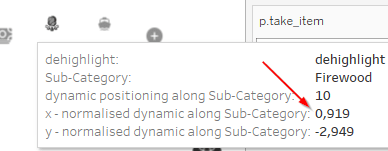
This means, an item whose dynamic position after shifting is say 10 would result in
( (10-1) * 360 / 17 ) + 90 = 280.5882 degrees. This is our angle.
Radians(280.6882) = 4.897
COS of this Radians is then 0.18375 which we multiply by 5 given the desired elliptical shape resulting in 0.919
You can grab excel or gsheets to do the math yourself.
Notice that our item that is ranked 1 in our dynamic position will automatically be put at the 90 degree angle (as the entire first part of the equation will equate to 0), resulting in a cosine of 0 and a sin of 1 multiplied by their respective factors of 5 and 3.
Calculating the dynamic position
This is all nice but without calculating the dynamic position, we are stuck. So let’s do this:
IF [p.take_item] =""  then [rank of selected item by sum of sales]
ELSEIF [original rank of selected item] = [rank of selected item by sum of sales]
    THEN 1
ELSEIF [rank of selected item by sum of sales] > [original rank of selected item]
    THEN  [rank of selected item by sum of sales]-([original rank of selected item]-1)
ELSEIF  [rank of selected item by sum of sales] < [original rank of selected item]
    THEN max({countd([Sub-Category])}) + [rank of selected item by sum of sales] - ([original rank of selected item]-1)
END
The first part just states that if our parameter is empty, simply put every item where it belongs according to its ranking by sum of sales (done in our [ rank of selected item by sum of sales ] calculation)
The second line stipulates that whatever item is the selected item shall be treated as position 1. Why? Because our “original rank of selected item” does nothing else then to attribute the rank of the selected item to itself and make it useable in our entire table.
window_max(if [p.take_item] = attr([Sub-Category]) then [rank of selected item by sum of sales] end)This will become clear in a second. But notice that the “original rank of selected item” grabs the ranking from the very basic ranking calculation and puts this ranking into a window_max function, thereby making it useable (literally) within our entire table.
The third part checks what to do if the rank of an item is larger than the one that we just selected .
Since we inverted both axis, this means to the right of our main / selected item we have position 2 and on the left, we have position 17.
Obviously, our rank [original rank of selected item] will be smaller than the original rank whenever we pick something to the right of our items.
Let’s disect this:
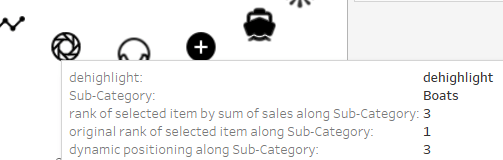
The headphones our our selected item and therefore, all rank calculations are one.
Shown above is a hovering over the boats which has its rank at 3. This is larger than the original rank of the selected item. If we now click the Plus, which is at rank 2, our first line of the calculation will put the plus at position 1 but the boats need to move to position 2 (dynamic).
Therefore, since 3 is larger than 1, the elseif condition holds true and we calculate
3 – (2 – 1) = 2 .
The three is position of boats now. The 2 refers to the position of the Pluses which we click from which we subtract one. Therefore, boats new, dynamic position, is now 2 and our carousel spins clockwise.
On the other hand have a look at the “three body problem” icon

It’s basic rank is 15. when we click on the trendline on its rights (position 16), the trendline will move to where headphones are, i.e. become the new position 1. The “three body problem” therefore must move from 15 to 17, counter clockwise.
This is handled in the last elseif condition.
The moment we click the trendline, the new “original rank of selected item” will be 16 and no longer 15 (remember, we transfer the rank 16 to our [original rank of selected item] calculation).
Therefore, the last elseif condition holds true for our three body problem (and all others except the circle) meaning that 15 is smaller than 16 and the executed calculation part equates to:
17 (our number of items overall) + 15 (rank of three body problem) – ( 16 (the original position of our trendline icon) – 1 = 15) = 17.
Therefore, the new dynamic position of three body problem icon will be 17 and its X/Y coordinates will be based on this.
Had we clicked the circle, then the tbb should only move 1 position counter clockwise, stipulated by
17 + 15 – (17 – 1 = 16) = 32-16 = 16
Explanatory table example

Here, we have Headpones selected. Headphones rank (see right column) is 1 and therefore, the original rank column is filled with 1. The dynamic positioning requires no adjustments.
Remember that in opur elipse position 2 is on the right from position 1 and position 3 is on the right of position 2 and so on (since we want it to spin clock wise).
Therefore, Headphones, Pluses and Boats would move three positions to the left implying they will be bypassing position 1 and basically take their position at the end of the que again.
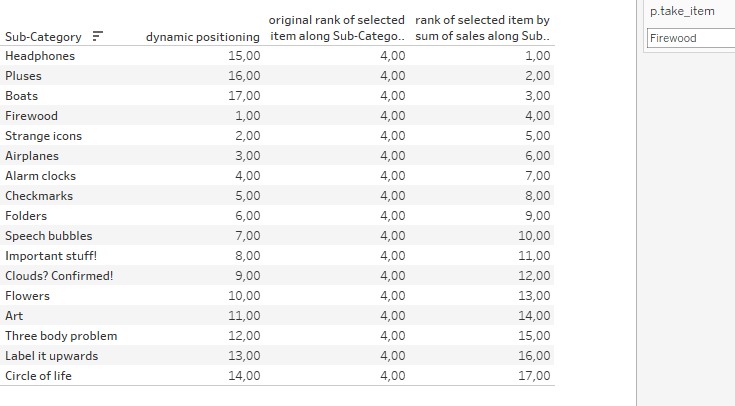
And this is exactly what happens. Headphones, Pluses and Boats trigger this part of the dynamic calculation
ELSEIF  [rank of selected item by sum of sales] < [original rank of selected item]
    THEN max({countd([Sub-Category])}) + [rank of selected item by sum of sales] - ([original rank of selected item]-1)
whereas the remaining items trigger this part
ELSEIF [rank of selected item by sum of sales] > [original rank of selected item]
    THEN  [rank of selected item by sum of sales]-([original rank of selected item]-1)
In case you haven’t noticed this should also explain the need for window_max in our [ original rank of selected item ] calculation.
If we try the calculation without the window_max it is still valud, but the original rank would only be available in Firewood, where it does not make any sense. We need this calculation to populate everything in our table (in the above case literal table and in the chart part in the underlying table).
final remarks
Some will have noticed that we are dehighlighting but not deselecting using the usual true/false filter trick.
The reason is that using this trick obstructs the viz animations which we need to create the spinning movement illusion.
Lastly, my recommendation is to float some blank containers over those parts that are further off from the currently selected item as unfortunately, the viz animations have the tendency to contract the circle and expand it instead of neatly moving the items along the circle boundaries. This is neglectable for two position off and almost unoticeable for one position but as of 3+ it becomes very obvious as the following, slowed down screen demonstrates.

And that’s it for today.
Find the workbook an my tableau public!
I hope you found that useful and as always appreciate your feedback.
Until next time.
Steffen

Leave a comment