Welcome to part 2 of our series on table calculations. In this part, we shall be looking into a side aspect that sometimes can be closely related to (the use of) table calculations.
Domain Completion, Domain Padding as well as Scaffolding (which we will not discuss here) are methods of dealing with sparse data, i.e. data that has missing bits.
We shall understand Domain Completion as adding marks at the intersection of dimensions.
Domain Padding, sometimes also (technically not 100% correct) referred to or rather conflated with scaffolding, means filling placeholders for missing data to assure uniformity in size / length of data batches.
Translated to the world of Tableau, we find that Tableau will allow to use Domain Padding whenever we have what is called a range aware pill in our view.
Range aware is a date, date-time or a bin. I.e. a field that clearly has a beginning and an end where beginning and end are defined by the data in our data source.
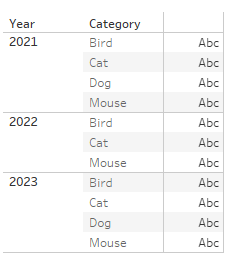
A Completion Example
This example is a made up for showing how completion works. The example data consists of years and categories which comprise bird, cat, dog and mouse and their respective count.
Notice that in 2022 we do not have a Dog.
We can now add an index() to it and will see.. nothing

However, recall that I said that completion is done at the intersection of two dimensions. Let us see what happens when we first add the Category also to columns:

Still we are missing the Dog in 2022.
But let us add back the index:
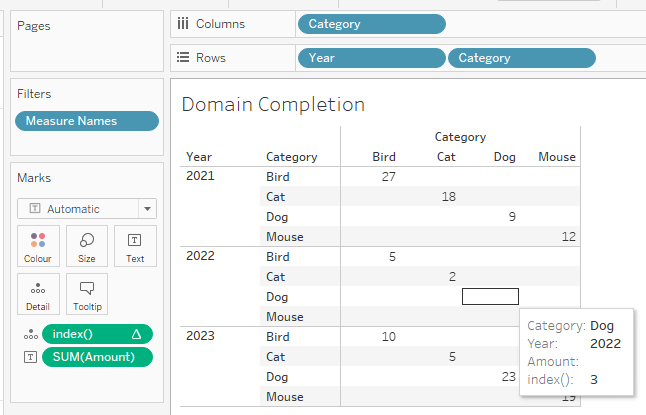
Now Tableau has completed the Category Domain and included Dog also in 2022 even though there are no measure values (after all, this dimension member does not even exist (!) in our data source in the first place).
I can achieve the same result by adding the year instead of the category but I cannnot achieve the same result by adding a fake dimension.
A padding example
In Tableau, we can observe Padding when using dates where it will fill in also months that maybe in one of the years are not even included in the data source.
You might need to click “show empty rows / empty columns” on the Analysis –> Table Layout tab.
Here is an example taken from the WOW2024-W15 mock data.
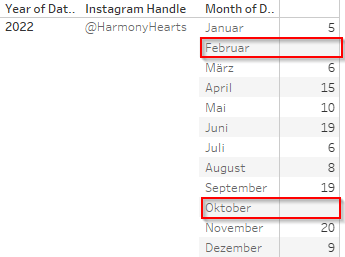
February is only shown due to me clicking:

There is no February data in the data source. Still Tableau will show February.
Contrasting, October actually IS in the data source, but null’ed. So, just no measure values with it but the dimension member October for the month dimension does exist in the source. Therefore, the original marks count is 11 which we pad to 12.
Another alternative is to right click the Month pill and select show missing values.
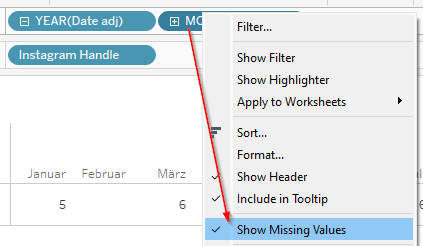
Either will increase the marks count from 11 to 12
Caveat – Continous pills
The first thing we need to recognize is that show empty cols / rows does not work when we are using a continuous pill.
On the following screenshot I have “show empty columns” enabled, but we see that February is basically being skipped:
The same effect applies if we use “show missing values” on the Month(Date adj) field, unless we use Domain Completion by adding an index() to the details and selecting the “show missing values” option.
Notice that the index() will not have any effect on “show empty rows” (or columns).
Caveat 2 – dimension on details
There is a further caveat which is very important to recognize.
On the previous screens that showed tables you will have figured that I used the dimensions on rows / cols in which case Tableau will pad.
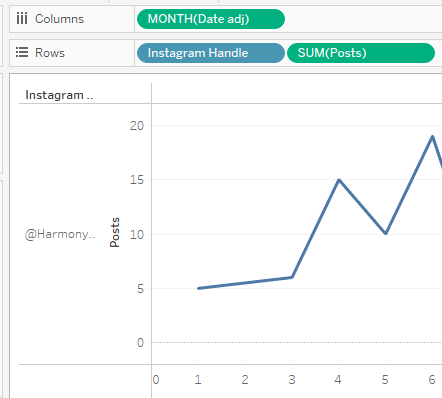
However, what happens if we move the months from rows to details?

We are missing the padded month of February for Harmony Hearts.
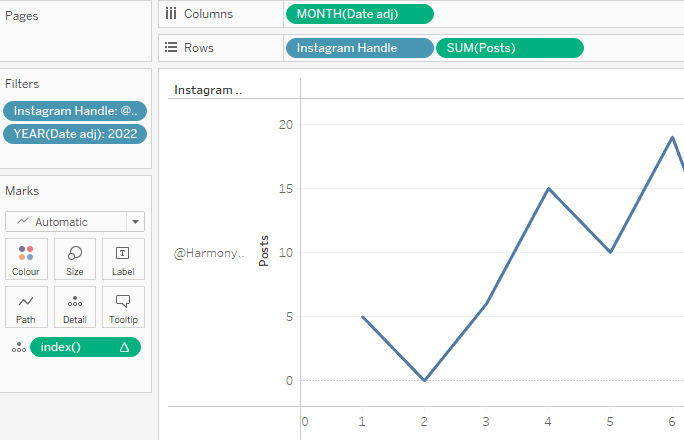
Enter Domain Completion.
Let us add an index to the details as well as set it to compute along [Date adj] field (this will cover the year and the month and set the instagram handle as our partition).

That concludes our excursus on data densification using domain padding and completion.
For detailed insights, I strongly recommend you read this blog by Jeffery Shaffer.
https://www.dataplusscience.com/DataDensification.html
In the last part of our series, we will apply all we have learned to this point at the example of WOW2024-W15.
And that’s it for today. I hope you found that useful.
As always appreciate your feedback.
Until next time.
Steffen

Leave a comment